Infra fürth gmbh: Unterschied zwischen den Versionen
(in Tabelle formatiert) |
|||
| Zeile 346: | Zeile 346: | ||
==Entwicklung der Gasabgabe== | ==Entwicklung der Gasabgabe== | ||
Entwicklung der Gasabgabe (in 1000 | Entwicklung der Gasabgabe (in 1000 m³ - Stand Ende 1981): | ||
Stadtgas | |||
{| class="wikitable sortable" | |||
! Jahr | |||
! Abnahme (Stadtgas) in 1000 m³ | |||
|- | |||
| 1865 || 179 | |||
|- | |||
| 1885 || 1.268 | |||
|- | |||
| 1905 || 5.343 | |||
|- | |||
| 1925 || 8.478 | |||
|- | |||
| 1945 || 5.324 | |||
|- | |||
| 1955 || 13.601 | |||
|- | |||
| 1965 || 24.274 | |||
|- | |||
| 1975 || 51.143 | |||
|} | |||
Erdgas: 1977 (26.632 = 64.982 Stadtgas) - 1979 (32.852 = 80.159 Stadtgas) - 1981 (40.228 = 98.156 Stadtgas). | Erdgas: 1977 (26.632 = 64.982 Stadtgas) - 1979 (32.852 = 80.159 Stadtgas) - 1981 (40.228 = 98.156 Stadtgas). | ||
Version vom 29. August 2025, 20:44 Uhr

|
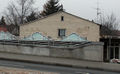
| Haupteingang der infra fürth gmbh, Leyher Straße 69. Im Hintergrund der denkmalgeschützte ehemalige Wasserturm |
- Unternehmen
- Infra fürth gmbh
- Gebäude
- Leyher Straße 69
- Geschäftsführer
- Marcus Steurer
- Gründungsort
- Fürth
- Gründungsdatum
- 1910
- Gesellschaftsform
- GmbH
- Standort
- Fürth
- Branche
- Versorger
- service@infra-fuerth.de
- Telefon
- +49 911 97044000
- Webseite
- www.infra-fuerth.de
- Ehemals
- Nein
- Leyher Straße 69 (Firma seit 1910)
Die infra fürth gmbh ist eine mittelbare städtische Eigengesellschaft der Stadt Fürth und der lokale Versorger für Strom, Erdgas, Wasser und Fernwärme. Die infra fürth erbringt außerdem Telekommunikations- und sonstige Energiedienstleistungen, betreibt drei Erdgastankstellen (Fürth und Langenzenn) sowie den Fürther Hafen.
Sie ist Rechtsnachfolgerin der Stadtwerke Fürth (STWF) und wurde durch die Eintragung in das Handelsregister am 19. August 1999 rückwirkend zum 1. Januar 1999 privatisiert.
Geschäftsführer ist aktuell Marcus Steurer, Aufsichtsratsvorsitzender Dr. Thomas Jung. Zuvor war über 21 Jahre der Geschäftsführer der infra fürth gmbh Dr. Hans Partheimüller, der allerdings zum 30. Juni 2018 in den Ruhestand ging.[1]
Überblick


Im Jahr 1910 wurden das bis dahin eigenständige Elektrizitätswerk, das Wasserwerk, das Gaswerk und die 1910 neu errichtete Müllverbrennungsanstalt zum Technischen Betriebsamt zusammengeführt. Erster Direktor war Franz Paul Bernhard Tillmetz. In den Jahren 1913 / 1914 entstand das dazugehörige Verwaltungsgebäude in der Theresienstraße, Ecke Ottostraße. Nach dem Ersten Weltkrieg Umbenennung in Städtisches Betriebsamt. 1945 erneute Umbenennung in Stadtwerke Fürth. 1999 Umwandlung zur infra fürth gmbh.[2]
Zum 1. Januar 2001 wurden die Geschäftsfelder Versorgung, Verkehr und Dienstleistung in die infra fürth holding gmbh & co. kg überführt. Seitdem ist auch die Bayernwerk AG (ehemals E.ON Bayern) mit 19,9 % am Versorgungsbereich beteiligt. Zum Jahresende 2013 beschäftigte die infra fürth gmbh insgesamt 411 Mitarbeiter, davon 25 Auszubildende. Die Bilanzsumme betrug 2012 328,1 Mio. €, die Umsatzerlöse 185,3 Mio. €.[3]
Stromversorgung
| Jahr | Stromabsatz (GWh) | Netzlänge (km) | Zählpunkte | Hausanschlüsse |
|---|---|---|---|---|
| 1999 | 463,1 | 1.080 | 73.733 | 17.589 |
| 2000 | 455,4 | 1.089 | 73.864 | 17.702 |
| 2001 | 490,0 | 1.127 | 74.050 | 17.988 |
| 2002 | 506,3 | 1.133 | 70.597 | 18.159 |
| 2003 | 527,6 | 1.138 | 71.128 | 18.317 |
| 2004 | 525,5 | 1.148 | 72.309 | 18.474 |
| 2005 | 516,4 | 1.151 | 72.243 | 18.594 |
| 2006 | 550,3 | 1.150 | 73.522 | 19.036 |
| 2007 | 530,5 | 1.085 | 74.648 | 19.208 |
| 2008 | 547,9 | 1.087 | 74.244 | 19.261 |
| 2009 | 530,5 | 1.088 | 74.864 | 19.411 |
| 2010 | 550,0 | 1.094 | 75.043 | 19.550 |
| 2011 | 465,1 | 1.098 | 76.471 | 19.618 |
| 2012 | 496,1 | 1.088 | 77.131 | 19.799 |
| 2013 | 439,4 | 1.098 | 77.218 | 19.917 |
| 2014 | 414,5 | 1.110 | 77.556 | 19.926 |
| 2015 | 418,0 | 1.124 | 78.784 | 20.061 |
| 2016 | 387,1 | 1.121 | 79.293 | 20.148 |
| 2017 | 379,9 | 1.136 | 79.686 | 20.312 |
| 2018 | 374,9 | 1.137 | 79.979 | 20.416 |
| 2019 | 647,0 | 1.136 | 80.899 | 20.628 |
| 2020 | 679,0 | 1.142 | 81.624 | 20.781 |
| 2021 | 688,9 | 1.148 | 82.280 | 20.868 |
| 2022 | 615,2 | 1.151 | 82.772 | 20.945 |
| 2023 | 521,5 | 1.152 | 82.987 | 21.025 |
| 2024 | tba | tba | tba | tba |
| 2025 | tba | tba | tba | tba |
Errichtung und Betrieb des Stromnetzes

.jpg)
Gegen Ende des 19. Jahrhunderts setzte nach der Erfindung der Glühlampe durch Thomas Edison und des Elektromotors durch Werner von Siemens die Elektrifizierung in vielen deutschen Städten ein. Auch in Fürth beachtete man diese Entwicklung und beschäftigte sich zu Beginn der 1890er Jahre mit der Frage der Elektrizitätsversorgung. Aufgrund einer Kommission, unter der Leitung des damaligen Bürgermeisters Ritter von Langhans, fasste der Stadtmagistrat am 30. Juni 1896 den Beschluß, die Verhandlungen über die Errichtung einer eigenen elektrischen Zentrale für die Stromversorgung der Stadt Fürth aufzunehmen. Gleichzeitig wurde die Fa. Elektrizitäts AG, vormals Schuckert & Co., Nürnberg, aufgefordert, den ungefähren Bedarf für Licht- und Kraftzwecke in Fürth festzustellen. Aufgrund der erarbeiteten Ergebnisse wurde nach siebenjährigen Verhandlungen und Beratungen am 19. Februar 1902 beschlossen, für die Stadt eine eigene elektrische Zentrale zu errichten. Ausschlaggebend für diesen Beschluss war vor Allem der Neubau des Stadttheaters, in welchem nach allgemeiner Überzeugung zur Beleuchtung und für technische Zwecke der elektrische Strom unbedingt erforderlich war sowie die künftige Beleuchtung des Bahnhofgebäudes.
Als Standort für die elektrische Zentrale wurde ein Areal zwischen der Theresienstraße und der Bahnstrecke Nürnberg–Würzburg ausgewählt. Die Arbeiten an dieser Zentrale und an der Verlegung des Ortsnetzes wurden so beschleunigt, dass bereits im September 1902, knapp sieben Monate nach der Beschlussfassung, das Netz probeweise unter Spannung gesetzt werden konnte. Als Tag der endgültigen Inbetriebnahme des Werkes kann der Beginn der Versorgung des neuen Stadttheaters mit elektrischer Energie anlässlich der ersten Vorstellung, am 17. September 1902, angenommen werden.
Die beiden in der Zentrale aufgestellten Gasdynamos waren für eine Leistung von je 140 kW Gleichstrom (Spannung 2 x 220 V) ausgelegt. Gleichzeitig wurde eine große Akkumulatorenbatterie mit einer Kapazität von 810 Ah installiert. In den ersten Jahren ging die Anmeldung von Privatabnehmern nur langsam und zögernd vor sich. Die Ausnutzung der Anlagen war entsprechend gering, erfüllte nicht die gehegten Erwartungen und bestätigte nicht die Erfahrungen aus anderen Städten. Die Bevölkerung erkannte nach und nach jedoch die großen Vorteile, die sich bei der Verwendung elektrischer Energie ergaben.
Von der Eigenerzeugung zum Strombezug

Die Zahl der Abnehmer, der angeschlossenen Geräte und damit die Stromabnahme nahmen hernach ständig zu. Im Jahre 1908 musste dann wegen der ständig steigenden Nachfrage die Leistung der Akkumulatorenbatterie auf 4.800 Ah erweitert werden. Ausserdem wurde zur Deckung des gestiegenen Strombedarfs ein Anschluss an die Überlandzentrale Ansbach hergestellt.
Im Jahr 1912 betrug die Stromabgabe 1,5 Mill. kWh. Wegen der ständig steigenden Nachfrage an Elektrizität stand die Stadt Fürth in den folgenden Jahren vor der Frage, die Stromerzeugungsanlagen bedeutend zu erweitern oder nach Möglichkeiten des Elektrizitätsbezugs von anderer Seite zu suchen. Das gleiche Problem hatte zu dieser Zeit die Stadt Nürnberg und das fränkische Überlandwerk. Nach langen Beratungen und Verhandlungen gründeten schliesslich am 28. November 1911 die Städte Nürnberg und Fürth zusammen mit der Elektriziäts AG und drei Privatbanken die Großkraftwerk Franken AG. Die Gründer waren übereingekommen, in der näheren Umgebung beider Städte (Gebersdorf) ein Dampfkraftwerk zu errichten. Die Energie sollte über 20-kV-Hochspannungskabel an der Stadtgrenze übergeben werden. Zwei Übergabestellen wurden eingerichtet und zwar nahe der Kreuzung der Fürther Schwabacher Straße mit der Nürnberger Rothenburger Straße sowie im Fürther Gaswerk. Diese beiden Übergabestellen wurden dann über 20-kV-Kabel mit der Zentrale in Gebersdorf verbunden.
Gleichzeitig ist die bisherige Kraftzentrale an der Theresienstraße zu einem Umformerwerk inklusive Umspannstation von 20 kV auf 5 kV umgebaut worden. Anstelle der alten Gasdynamos wurden Einankerumformer aufgestellt deren Leistung zunächst 700 kW betrug und im Laufe der folgenden fünfzehn Jahre auf 5.200 kW erhöht wurde. Ein Teil dieser Umformer ist 1926 im Umformerwerk Theresienstraße abgebaut und in dem 1906 errichteten Gaswerk an der Leyher Straße aufgebaut worden. Im Jahr 1914 betrug die Stromabgabe 2,1 Mill. kWh. Während des Ersten Weltkriegs trat eine Stagnation ein. Nach dem Krieg stieg der Stromverbrauch aber wieder an, so dass schon 1923 3,8 Mill. kWh abgegeben werden konnten. 1927, also nach fünfundzwanzigjähriger Betriebszeit des E-Werks betrug die Stromabgabe 9,7 Mil. kWh. Im Betrieb waren zu jener Zeit 62 Transformatoren mit einer Nennleistung von 13.200 kVA sowie vier Einankerumformer und die Akkumulatorenbatterien. Die Länge der Versorgungsleitungen betrug 200 km. An das Niederspannungsnetz waren 2.900 Anwesen mit 11.300 Zählern angeschlossen. Mit Hochspannung wurden 39 Abnehmer versorgt.

In den folgenden Jahren bis zum Ausbruch des Zweiten Weltkriegs waren wesentliche Erweiterungen an den Betriebseinrichtungen nicht erforderlich. Während des Zweiten Weltkriegs konnte die Stromversorgung trotz der immer schwieriger gewordenen Verhältnisse fast störungsfrei durchgeführt werden. Eine größere Unterbrechung der Versorgung der ganzen Stadt entstand in der Nacht vor dem Einmarsch amerikanischer Truppen im April 1945. Damals wurde durch einen Granattreffer die Hochspannungsanlage an der Theresienstraße so stark beschädigt, dass die Stromversorgung restlos zum Erliegen kam. Die Wiederinstandsetzungsarbeiten wurden aber so beschleunigt durchgeführt, dass nach zehn Tagen die Versorgung wieder aufgenommen werden konnte.[5]
Umstellung auf Drehstrom


Die Stromversorgung aus dem neuen Kraftwerk der Großkraftwerk Franken AG ist am 25. März 1913 aufgenommen worden. Mit dem Anschluss an die Großkraftwerk Franken AG war die Stromversorgung in ein neues Stadium getreten. Es hatte sich der Übergang von der Eigenerzeugung zum Strombezug vollzogen. Nun war auch die Möglichkeit gegeben, größere Industrieabnehmer mit elektrischer Energie aus dem städtischen Stromversorgungsnetz zu beliefern. Diese Aufgaben konnten nach Verlegung entsprechender 20- und 5-kV-Kabel in Angriff genommen werden. Dabei bot sich gleichzeitig die Möglichkeit des Aufbaus eines Drehstomnetzes mit einer Gebrauchsspannung von 3 x 220 / 380 Volt. Da hier ebenfalls zu Beginn der Bedarf recht gering war, begann die großflächige Umstellung des Stromnetzes erst nach Ende des Zweiten Weltkriegs, lediglich Teile der Fürther Südstadt wurden bereits um 1929 auf die neue Stromart umgestellt um das Gleichstromnetz zu entlasten. Bis 1945 war der Stromverbrauch auf 20 Mill. kWh angestiegen. Die Belastung betrug dabei 5.700 kW. In den ersten Nachkriegsjahren mussten aufgrund der Kriegsauswirkungen und nachdem sich die Elektrifizierung und damit der Strombedarf uneingeschränkt fortsetzten, die Stromlieferungen rationiert werden. Die Rationierung erfolgte in Form von zeitweiser Abschaltung von Betrieben, ganzen Stadtteilen oder Vororten, und wurde im Amtsblatt angekündigt. Zur Entlastung des Gleichstromnetzes musste nun mit der endgültigen Umstellung von Gleichstrom- auf Drehstromversorgung begonnen werden. Diese Umstellung begann 1948 und dauerte bis 1955. Bis zum Ende der Umstellung war der jährliche Stromverbrauch auf 53 Mill. kWh angestiegen. Die in Anspruch genommene Leistung betrug damals etwa 15.000 kW.[6]
Eigene Umspannwerke decken steigenden Bedarf

Nach der Stromartumstellung von Gleichstrom auf Drehstrom hat sich die Aufwärtsentwicklung in der Stromversorgung weiter fortgesetzt. Es war schließlich notwendig, weitere größere Verstärkungen in den Stromversorgungseinrichtungen durchzuführen. So entstand 1958 das erste 110 / 20 kV Umspannwerk innerhalb des Stadtgebiets an der Dambacher Straße. 1971 folgte das zweite UW an der Vacher Straße. Die beiden Umspannwerke lagen an einer starken Leitungsschiene, die zwischen den beiden Kraftwerken Franken I (Gebersdorf) und Franken II (Frauenaurach, existiert heute nicht mehr) der Großkraftwerk Franken AG verlegt wurde. Mit dieser Schiene war die Versorgung der Stadt von beiden Kraftwerken aus möglich. Nach fünfundsiebzig jährigem Bestehen der Elektrizitätsversorgung betrug der gesamte Stromverbrauch von Bevölkerung und Industrie nun jährlich 250 Mill. kWh. Die in Anspruch genommene Leistung betrug dabei 57.000 kW. Diese Energie wird über umfangreiche Hoch- und Niederspannungskabelnetze über das gesamte Stadtgebiet verteilt. Die Gesamtlänge des 20-kV-Netzes beträgt 1977 bereits 180 km, die des 400-V-Netzes 470 km. Zu diesem Zeitpunkt sind 160 Transformatorenstationen in Betrieb, in denen die Spannung von 3 x 20 kV auf 3 x 220 / 380 V transformiert wird. 66 Abnehmer wurden wegen des großen Leistungsbedarfs direkt mit Mittelspannung beliefert. Für die Erfassung des Stromverbrauchs sind Ende der siebziger Jahre knapp 51.000 Zähler im Versorgungsnetz eingebaut.[7] 1993 erfolgt schließlich der Bau des dritten und voraussichtlich letzten 110 / 20-kV-Umspannwerks auf dem Werksgelände der Stadtwerke an der Leyher Straße 69.
Im Jahr 2006 werden bereits 72.300 Haushalte über rund 1.151 km Leitungen mit elektrischer Energie versorgt.[8] In einer eigens eingerichteten Verbundnetzleitstelle werden die elektrischen Anlagen im Stadtgebiet rund um die Uhr überwacht und gesteuert. 2010 betrug der Gesamtstromverbrauch 572 Mill. kWh bei einer Höchstleistung von 97.449 kW.[9]
Strom aus erneuerbaren Energien


Stromerzeugung aus Sonnenlicht und Wasserkraft wird von der infra fürth gmbh seit über zwei Jahrzehnten erfolgreich betrieben und konsequent ausgebaut. So sind neben der bewährten Wasserkraftanlage an der Uferstraße in den letzten Jahren eine Vielzahl an Photovoltaikanlagen wie Solarberg und Solarwall am Golfplatz Fürth, entstanden, zuletzt zwei größere Anlagen bei Heilsbronn sowie bei Kirchfembach. Mit Inbetriebnahme des neuen Bioenergiezentrums nahe Raindorf können weitere 6.200 Haushalte mit umweltfreundlichem Strom beliefert werden.[10] Ziel ist es, bis zum Jahr 2021 rund 25 Prozent des Strombedarfs selbst aus erneuerbaren Energien zu erzeugen.[11]
Gasversorgung
| Jahr | Erdgasabsatz in GWh | Netzlänge in km | Anzahl Zählpunkte | Anzahl Hausanschlüsse |
|---|---|---|---|---|
| 1999 | 1.219,1 | 414 | 27.362 | 11.971 |
| 2000 | 1.165,5 | 418 | 28.358 | 12.275 |
| 2001 | 1.247,2 | 434 | 28.593 | 12.509 |
| 2002 | 1.196,2 | 436 | 28.515 | 12.853 |
| 2003 | 1.251,1 | 439 | 28.499 | 13.082 |
| 2004 | 1.298,2 | 443 | 28.760 | 13.327 |
| 2005 | 1.301,1 | 434 | 28.743 | 13.517 |
| 2006 | 1.305,9 | 442 | 2.766 | 13.695 |
| 2007 | 1.231,0 | 443 | 28.723 | 13.039 |
| 2008 | 1.262,3 | 447 | 28.616 | 13.397 |
| 2009 | 1.187,6 | 452 | 18.607 | 13.507 |
| 2010 | 1.208,5 | 454 | 28.456 | 13.640 |
| 2011 | 1.036,9 | 455 | 28.551 | 13.758 |
| 2012 | 1.233,0 | 457 | 28.447 | 13.919 |
| 2013 | 1.285,7 | 458 | 28.167 | 14.046 |
| 2014 | 1.031,3 | 464 | 28.379 | 14.296 |
| 2015 | 1.077,5 | 465 | 28.476 | 14.546 |
| 2016 | 1.363,0 | 466 | 28.500 | 14.651 |
| 2017 | 1.134,4 | 468 | 28.421 | 14.804 |
| 2018 | 1.170,0 | 468 | 28.431 | 14.901 |
| 2019 | 1.111,0 | 469 | 28.418 | 15.015 |
| 2020 | 1.082,5 | 471 | 28.473 | 15.154 |
| 2021 | 1.207,4 | 472 | 28.377 | 15.314 |
| 2022 | 1.083,8 | 474 | 28.247 | 15.340 |
| 2023 | 979,4 | 474 | 27.949 | 15.353 |
| 2024 | tba | tba | tba | tba |
| 2025 | tba | tba | tba | tba |
Stadtgas
.jpg)
Solange das Gas nur zur Beleuchtung diente, verlief die Entwicklung in gemächlichen Bahnen. Als aber der Bunsenbrenner das Gas als Heizmittel interessant machte, stieg der Absatz beträchtlich. Um die Wende zum 20. Jahrhundert verbrauchten die Fürther bereits 3 Millionen Kubikmeter (m³) Gas im Jahr. Am 1. Dezember 1903 wurde daher der Bau eines neuen Gaswerkes beschlossen. Für den Bau war ein Kredit von über 2,9 Millionen Mark nötig.[13] Daraufhin wurde bis 1906 auf dem Gelände zwischen Leyher Straße und Karolinenstraße ein neues Gaswerk mit der dreifachen Kapazität errichtet. Am 10. November 1906 gingen in Betrieb: 12 Gaserzeugungsöfen mit zusammen 108 schräg liegenden Retorten mit je 360 kg Kohle Fassungsvermögen, 1 Wassergasgenerator für eine Stundenleistung von 450 m³, 1 Gasbehälter für 30.000 m³ Stadtgas und ein Gasbehälter für 800 m³ Wassergas (Mischung aus Kohlenmonoxid und Wasserstoff). Das alte Gaswerk an der Theresienstraße wurde im Februar 1907 stillgelegt und abgebrochen.
Während des 1. Weltkriegs und teilweise auch während der folgenden Inflationsjahre erschwerten Rekrutierungen des Personals und Kohlemangel die Betriebsführung. Trotz der Schwierigkeiten den Betrieb aufrecht zu erhalten, wurde eine Trocknungsanlage zum Dörren von Obst und Gemüse genutzt, das an die kriegsgebeutelte Bevölkerung ausgegeben wurde.[14]
Gleiches galt für die Zeit des 2. Weltkriegs. Hinzu kamen schwere Bombenschäden am Gasbehälter und am Verwaltungsgebäude. Die Gaserzeugung wurde am 10. Mai 1945 wieder aufgenommen, allerdings gab es Verbrauchsbeschränkungen durch Sperrstunden. Diese konnten erst nach Besserung der Kohleversorgung Anfang 1948 wieder aufgehoben werden.
Die veralteten Anlagen konnten nur in beschränktem Umfang verbessert und modernisiert werden. Im Frühjahr 1954 standen zur Verfügung: 5 Vertikalkammeröfen mit zusammen 20 Kammern mit je 2.300 kg Fassungsvermögen für Kohle, 2 Wassergasgeneratoren für eine Stundenleistung von 450 bzw. 750 m³. Trotz weiterer Modernisierungen konnte bald der durch das stetige Wachstum der Bevölkerung und der Gewerbebetriebe gestiegene Verbrauch nicht mehr gedeckt werden. Bis 1965 wurden täglich 15 - 18 Güterwaggons Kohle pro Tag angeliefert.[15] Aus wirtschaftlichen Erwägungen wurde 1965 beschlossen, das Gas von der EWAG Nürnberg zu beziehen.[16]
Umstellung auf Erdgas
Ein zunehmender Ausbau der Erdgasleitungen in Deutschland ermöglichte 1975 die Umstellung der Fürther Haushalte auf diese, vergleichsweise modernere und umweltschonendere, Energie. Die Umstellung von Stadt- auf Erdgas war in nur fünf Monaten abgeschlossen.[17] Es folgte ein umfangreicher Ausbau des Gasnetzes und damit verbunden eine steigende Nachfrage in den Fürther Haushalten. Im Verwaltungsgebäude in der Theresienstraße öffnete daraufhin die stadtwerkseigene Gasgeräteausstellung.[18]
Bis 2001 schlossen sich die Landkreisgemeinden Langenzenn, Seukendorf, Cadolzburg, Veitsbronn, Obermichelbach und Wilhermsdorf an das Erdgasnetz der infra an.[19]
Anschluss an das Hochdrucknetz
Im Jahr 2006 erfolgte durch eine Verbindungs- und Speicherleitung im Wiesengrund der Regnitz der direkte Anschluss an das Hochdrucknetz der E.ON. (Übergabepunkt Königsmühle). Die Gasübergabestellen zur N-Ergie (ehemals EWAG) wurden stillgelegt.
Biogaserzeugung
2010 wurde westlich von Fürth bei Raindorf mit dem Bau einer Biogasanlage begonnen. Die Anlage liefert seit Ende 2011 und kann aufgrund ihrer Lage direkt ins örtliche Gasverteilungsnetz einspeisen. Durch die hauptsächliche Vergärung von Mais aus der Region kann somit ca. 5% des Fürther Gasbedarfs gedeckt werden.
Entwicklung der Gasabgabe
Entwicklung der Gasabgabe (in 1000 m³ - Stand Ende 1981):
| Jahr | Abnahme (Stadtgas) in 1000 m³ |
|---|---|
| 1865 | 179 |
| 1885 | 1.268 |
| 1905 | 5.343 |
| 1925 | 8.478 |
| 1945 | 5.324 |
| 1955 | 13.601 |
| 1965 | 24.274 |
| 1975 | 51.143 |
Erdgas: 1977 (26.632 = 64.982 Stadtgas) - 1979 (32.852 = 80.159 Stadtgas) - 1981 (40.228 = 98.156 Stadtgas).
Wasserversorgung
| Jahr | Wasserabgabe in Mio m³ | Netzlänge in km | Anzahl Zählpunkte | Anzahl Hausanschlüsse |
|---|---|---|---|---|
| 1999 | 6,7 | 334 | 14.741 | 14.777 |
| 2000 | 6,8 | 335 | 14.876 | 14.911 |
| 2001 | 7,0 | 338 | 14.976 | 15.034 |
| 2002 | 6,9 | 340 | 15.228 | 15.218 |
| 2003 | 7,5 | 341 | 15.382 | 15.371 |
| 2004 | 7,0 | 342 | 15.670 | 15.467 |
| 2005 | 6,9 | 342 | 15.755 | 15.561 |
| 2006 | 7,0 | 343 | 15.889 | 15.683 |
| 2007 | 6,9 | 394 | 18.935 | 18.287 |
| 2008 | 6,9 | 395 | 18.578 | 18.391 |
| 2009 | 6,7 | 423 | 18.698 | 18.554 |
| 2010 | 6,7 | 423 | 18.794 | 18.661 |
| 2011 | 6,7 | 423 | 18.882 | 18.710 |
| 2012 | 7,0 | 423 | 18.956 | 18.706 |
| 2013 | 6,8 | 426 | 19.069 | 17.925 |
| 2014 | 6,8 | 426 | 19.207 | 18.092 |
| 2015 | 7,2 | 426 | 19.352 | 18.193 |
| 2016 | 7,2 | 427 | 19.458 | 18.203 |
| 2017 | 7,2 | 427 | 19.515 | 18.343 |
| 2018 | 7,8 | 429 | 19.588 | 18.393 |
| 2019 | 7,6 | 427 | 19.612 | 18.436 |
| 2020 | 8,0 | 428 | 19.699 | 18.501 |
| 2021 | 7,5 | 428 | 19.755 | 18.569 |
| 2022 | 7,6 | 428 | 19.760 | 18.599 |
| 2023 | 7,3 | 428 | 19.822 | 18.664 |
| 2024 | tba | tba | tba | tba |
| 2025 | tba | tba | tba | tba |
Errichtung und Betrieb des Wassernetzes
.jpg)
Am 22. Januar 1885 erfolgte der Beschluss des Fürther Stadtmagistrats ein eigenes Wasserwerk zu errichten. Der stetig gestiegene Wasserverbrauch machte diesen Schritt nötig, die öffentlichen und privaten Pumpbrunnen, welche bisher der Wasserversorgung dienten, konnten die benötigten Mengen nicht mehr liefern und waren zudem sehr witterungsabhängig. Im Jahr 1887 wurde das erste Fürther Wasserwerk im Rednitztal am Brunnenweg in Betrieb genommen. Die Wassergewinnung erfolgte mittels Flachbrunnen im Rednitztal, für Speicherung und Druckerzeugung wurde 1888 ein Wasserhochbehälter an der Alten Veste errichtet. 1890 wurde der Centaurenbrunnen als Denkmal zur Errichtung der zentralen Wasserversorgung in Fürth eingeweiht.
Ab 1901 wurde mit der Anbindung der umliegenden Ortschaften an die zentrale Wasserversorgung begonnen (1901: Poppenreuth, 1906: Oberfürberg und Unterfürberg, 1924/25: Burgfarrnbach, Unterfarrnbach und Atzenhof, 1927/28: Weikershof).
In der Folgezeit wurden die Betriebsanlagen stetig erweitert und den Bedürfnissen der Stadt angepasst. Im Fürther Stadtwald, nahe der Lungenheilstätte, wurde ein zweiter Hochbehälter errichtet (sog. Katzenstein), ab 1985 erfolgte der Bau eines neuen und modernen Wasserwerks an der Dianastraße. Im September 2012 wurde bekannt, dass der Hochbehälter an der Alten Veste um eine zusätzliche Kammer erweitert wird.[21][22] Der 6200 Kubikmeter fassende Speicher ging 2015 in Betrieb.[23]
Fernwasserversorgung Allersberg
Ende der 1950er Jahre war die Leistungsgrenze der vorhandenen Wassergewinnungsanlagen im Rednitztal erreicht. Eine weitere Erschließung von Grundwasser mittels Flach- oder Tiefbrunnen war auf Fürther Boden nicht mehr möglich, so wurde schließlich 1963 in der Gegend westlich von Allersberg mit Probebohrungen begonnen. Nach Bau der entsprechenden Gewinnungsanlagen (20 Tiefbrunnen mit 90 - 120 m Tiefe) sowie der Verbindungsleitung nach Fürth, konnte die Fernwasserversorgung am 30. Oktober 1968 ihren Betrieb aufnehmen. Das Wasser fließt die 32 km lange Strecke im freien Gefälle - teilweise in einer Gemeinschaftsleitung mit dem Zweckverband Wasserversorgung Fränkischer Wirtschaftsraum[24] - bis zur Übergabestelle in Dambach (Vestner Weg).[25] Aus dem Wassergewinnungsgebiet versorgt die infra auch den lokalen Zweckverband der Brunnbach-Gruppe mit Wasser.[26]
Vom Grundwasser bis zum Trinkwasser
Etwa 50 % des Wasserbedarfs werden aus dem Grundwasser im Rednitztal gedeckt, weitere 45 % aus dem Fernwasserwerk Allersberg (aus 20 Tiefbrunnen bis 120 m), die letzten 5 % werden aus einem Wasserwerk der infra im Knoblauchsland gedeckt. Nach Gewinnung, Speicherung und Aufbereitung folgt die Verteilung des Wassers im Stadtgebiet über das vorhandene Rohrnetz. Hierbei gilt es die Besonderheit der zwei verschiedenen Druckzonen zu beachten: die sog. Niederdruckzone (ca. 5 - 7 bar) herrscht in der Altstadt, Innenstadt, Südstadt sowie Oststadt und in Dambach vor, die Hochdruckzone (ca. 7 - 9 bar) versorgt die weiter entfernten oder höherliegenden Stadtteile wie Hardhöhe, Eigenes Heim, Nordstadt und die umliegenden Ortschaften. Eine weitere Besonderheit stellen die Ortsteile Stadeln und Mannhof dar, welche über eine separate Wassergewinnung und Verteilung mit 5 - 6 bar Druck verfügen. Seit Juni 2012 wird das im Rednitzgrund geförderte Wasser nicht mehr automatisch mit Chlordioxid versetzt ("gechlort"), sondern nur noch ereignisbezogen, z. B. bei Hochwasser, wenn eine Verunreinigung mit Keimen befürchtet werden muss.[27][28][29]
Im Jahr 2019 wurde mit dem Markt Cadolzburg ein Wasserlieferungsvertrag über jährlich bis zu 150 000 m3 Trinkwasser für zunächst 30 Jahre abgeschlossen. Dazu muss noch eine etwa 3 km lange Rohrleitung DN 150 vom Hochbehälter hinter dem Waldkrankenhaus bis nach Egersdorf verlegt und eine Pumpstation am Fürther Wasserspeicher errichtet werden.[30][31]
Fernwärmeversorgung
| Jahr | Wärmeabgabe in GWh | Netzlänge in km | Anzahl Zählpunkte |
|---|---|---|---|
| 1999 | 41,4 | 18 | 223 |
| 2000 | 41,7 | 18 | 243 |
| 2001 | 49,5 | 22 | 272 |
| 2002 | 54,1 | 19 | 353 |
| 2003 | 51,4 | 21 | 520 |
| 2004 | 57,7 | 25 | 644 |
| 2005 | 60,1 | 25 | 683 |
| 2006 | 58,7 | 29 | 717 |
| 2007 | 52,7 | 30 | 734 |
| 2008 | 59,2 | 30 | 763 |
| 2009 | 59,6 | 31 | 793 |
| 2010 | 62,7 | 31 | 839 |
| 2011 | 58,5 | 30 | 856 |
| 2012 | 59,4 | 30 | 874 |
| 2013 | 62,9 | 31 | 918 |
| 2014 | 53,3 | 31 | 945 |
| 2015 | 54,6 | 31 | 981 |
| 2016 | 60,4 | 31 | 993 |
| 2017 | 62,9 | 32 | 1.011 |
| 2018 | 63,0 | 32 | 1.027 |
| 2019 | 63,9 | 32 | 1.038 |
| 2020 | 66,4 | 33 | 1.056 |
| 2021 | 81,0 | 32 | 1.082 |
| 2022 | 69,6 | 32 | 1.088 |
| 2023 | 67,2 | 32 | 1.138 |
| 2024 | tba | tba | tba |
| 2025 | tba | tba | tba |
Fernwärmenetze in Fürth
Die infra fürth gmbh betreibt im Fürther Stadtgebiet fünf voneinander unabhängige Fernwärmenetze. Dieses sind im Einzelnen das Netz 1 (Heizwerk Fronmüllerstraße), Netz 2 (Heizwerk Dambach), Netz 3 (Heizwerk Schwand) sowie das Netz 4 (Heizwerk Vacher Straße). Seit 2020 ist ein fünftes Netz im Bereich zwischen Würzburger Straße und Hansastraße in Betrieb. Das Heizwerk versorgt das Wohngebiet Westwinkel.
Andere im Stadtgebiet befindliche Fernwärmenetze sind privat betriebene, meist mittels BHKW gespeiste Anlagen, welche nicht im Verantwortungsbereich der infra liegen.
Die Entstehung der Fernwärmenetze basiert zum Großteil auf den Anforderungen der bis 1995 in Fürth stationierten US-Streitkräfte.
Straßenbeleuchtung

Bereits Ende des 18. Jahrhunderts gab es in Fürth eine (leider nicht genauer beschriebene) Form von Straßenbeleuchtung: So wird im "Handbuch für Kaufleute: für die Jahre 1785 und 1786" gelobt: "Auch ist bereits für die eben so angenehme als nützliche Beleuchtung der Straßen, zur Nachtzeit gesorgt, und man beeifert sich selbige immer vollkommener zu machen."[33]
1822 wurde die Straßenbeleuchtung mittels Öllaternen eingeführt. Am 20. November 1822 war es endlich soweit, dass das nächtliche Dunkel mit 86 [sic!] Öllaternen erhellt wurde. Laternen und Drähte kosteten über 3.000 fl. Die Unterhaltung besorgten die Bürger durch freiwillige Beiträge.[34] Im Lauf der Jahre genügte der Bevölkerung diese einfache und bescheidene Beleuchtung nicht mehr. Deshalb wurde am 1. Juli 1857 mit Ludwig August Riediger aus Augsburg ein Vertrag über den Bau eines Gaswerks und die Errichtung einer Gas-Straßenbeleuchtung abgeschlossen. Anstelle der inzwischen 122 Öllaternen sollten 233 Gaslaternen aufgestellt werden.
Die "Gasanstalt" wurde an der Theresienstraße, zwischen Ottostraße und Hirschenstraße, errichtet. Nach Fertigstellung aller Betriebsanlagen übernahm am 1. Juli 1858 die "Aktiengesellschaft für Gasbeleuchtung zu Fürth" das Gaswerk.
Am Kirchweih-Samstag, 2. Oktober 1858, erfolgte die feierliche Eröffnung: Die Gas-Straßenbeleuchtung wurde in Betrieb genommen. Das Rathaus wurde durch Hunderte von Gasflammen festlich illuminiert.[35]
Im Lauf der nächsten Jahre erfolgte zügig der weitere Ausbau der Straßenbeleuchtung; am 1. September 1871 war es dann geschafft; alle Straßen und Plätze der Stadt Fürth wurden ausschließlich mit Gas beleuchtet.
Bereits 1891 führte man dann erste Versuche mit einer elektrischen Straßenbeleuchtung durch: So wurde die Kirchweih vom Waagplatz bis zur katholischen Kirche mit 18 Bogenlampen elektrisch beleuchtet. Im Juli 1895 wurde in einem Teil der Schwabacher Straße probeweise Gasglühlicht eingeführt. Nachdem sich das Gasglühlicht bewährt hatte, wurde beschlossen, dieses allmählich in der ganzen Stadt einzuführen.[36]
Ab 1907 wurde damit begonnen, einzelne Straßen dauerhaft elektrisch zu beleuchten.
Mit Errichtung und Ausbau des elektrischen Netzes ging die Zahl der mit Gas betriebenen Leuchten stetig zurück. Am 15. September 1967 wurde die letzte im Stadtgebiet noch betriebene Gaslaterne Ecke Geierstraße und Lange Straße endgültig gelöscht.[37]

2006 entschied man sich für eine erneute Modernisierung des Beleuchtungsnetzes. Bis zum Jahr 2012 wurden alle veralteten Quecksilber-Dampflampen gegen effizientere Natrium-Dampfhochdruckleuchten getauscht.[38] 2024 erneuerte die Stadt die Straßenbeleuchtung. Die bisherigen Natrium-Dampfhochdruckleuchten wurden durch energiesparende LED-Lampen ersetzt. Insgesamt wurden rund 11.500 Lampen im Stadtgebiet ausgetauscht. Nach eigenen Angaben war die damit einhergehende Energieersparnis „bayernweit und somit auch in der Metropolregion spitze". Durch den Wechsel der Leuchtmittel würden insgesamt 54 Prozent des bisherigen Stromverbrauchs reduziert und den Austauschintervall auf bis zu 24 Jahren pro Leuchtmittel erhöht. Das entspräche ca. 500 Tonnen CO-2 weniger pro Jahr. Weitere Vorteile der neuen Leuchtmittel, so die Stadt Fürth, sei das neue warmweiße Licht, dass sich positiver auf den Insekten- und Artenschutz auswirken würde. Die Kosten der Modernisierung beliefen sich auf ca. 1,4 Mio Euro, die aber durch die gesenkten Energiekosten nach eigenen Angaben schon bald amortisiert seien. Die "letzte" Lampe wurde pressewirksam mit OB Dr. Thomas Jung und infra-Geschäftsführer Marcus Steuerer in der Marienstraße am 4. November 2024 ausgetauscht.[39]
2009 ersetzte bereits die infra die 1.900 Glühlampen am Rathaus durch energiesparende LED-Lampen.
Die Straßenbeleuchtung ist im Eigentum der Stadt Fürth. Die infra fürth betreut die technischen Anlagen der Straßenbeleuchtung im Auftrag der Stadt.
Stadtverkehr

Für den Stadtverkehr in Fürth ist die infra fürth verkehr gmbh zuständig, die durch Abspaltung des Teilbereichs Verkehr aus der infra fürth gmbh entstanden ist.
Für Streckenführung, Liniennummern, Geschichte des Bus- und U-Bahnverkehrs etc. siehe separate Artikel "Buslinien" sowie "U-Bahn" !
Seit dem 28. Januar 2018 fährt der erste E-Bus Nordbayerns in Fürth für die infra. Allerdings fiel die Probefahrt für die Medienvertreter ins "Wasser", da sich der Bus nicht starten lies. Bei dem E-Bus handelt es sich um einen Zweiachser mit 35 Sitz- und 42 Stehplätzen. Der Bus hat an der Hinterachse zwei emissionsfreie Elektromotoren und kann damit ca. 200 km weit fahren. Die Ladezeit der Batterien beträgt an der eigens hierfür angeschafften Ladesäule knapp 2,5 Stunden.[40] 2023 sind bereits sechs vollelektrisch betriebene Busse im Einsatz und es sollen in dem Jahr noch drei weitere hinzukommen.[41]
Dienstleistungen
In der infra fürth dienstleistung gmbH werden EDV-Dienstleistungen für die einzelnen Gesellschaften der infra fürth sowie für die Stadt Fürth angeboten.
Zwischen dem 1. Januar 2004 und den 31. Dezember 2006 hat die infra fürth die Geschäfts- und kaufmännische Leitung des Zweckverbandes zur Wasserversorgung des Knoblauchslandes übernommen.
Bis zum 31. Dezember 2005 wurde im Auftrag der Stadt Fürth durch den Geschäftsbereich Bäder die Öffentlichen Frei- und Hallenbäder betrieben.
Weiterhin werden im Auftrag der Stadt Fürth durch die infra fürth und ihre Gesellschaften folgende Aufgaben wahrgenommen: Straßenbeleuchtung, Flusswasserkontrolle, öffentliche Brunnen, städtische Uhrenanlagen und Verbrauchsabrechnung für die Stadtentwässerung.
Beteiligungen
- 1992 gründeten die Stadtwerke Fürth zusammen mit der EWAG (heute: N-Ergie), der Erlanger Stadtwerke AG und der Stadtwerke Schwabach GmbH die gemeinnützige Solarenergie-, Informations- und Demonstrationszentrum Solid GmbH mit Sitz in Fürth. Die infra fürth gmbh hält 28,2 % der Anteile.
- Die infra fürth verkehr gmbH ist als "Grundvertragspartner" mit 10,53 % an der Verkehrsverbund Großraum Nürnberg GmbH beteiligt.
- Die infra fürth gmbh ist an der M-net Telekommunikations GmbH beteiligt.
- Seit 2021 besteht eine gemeinsame Gesellschaft mit der N-Ergie aus Nürnberg, den Stadtwerken Schwabach, den Erlanger Stadtwerken, den Stadtwerken Stein und den Gemeindewerken Wendelstein, die Ökostrom Franken GmbH & Co. KG.
- Es bestehen weitere Beteiligungen.
Übersicht Direktoren/Werkleiter

Städtisches Gas- und Wasserwerk
- Jakob Lindmann (? - 1910)
Städtisches Elektrizitätswerk
- Franz Paul Bernhard Tillmetz (1905 - 1910)
Technisches Betriebsamt und Nachfolger
- Franz Paul Bernhard Tillmetz (1910 - 1917)
- Georg Spitzfaden (1918 - 1945)
- Karl Graf (1946 - 1949)
- Hans Eckerlein (1949 - 1961)
- Hans Drechsel (1961 - 1976)
- Horst Staackmann (1977 - 1997)
- Hans Partheimüller (1997 - 2018)
- Marcus Steurer (2018 - heute)
Literatur
- Einiges aus der gemeindlichen Bautätigkeit in Fürth i. B. - Portalbau beim neuen Hochbehälter des Wasserwerks. In: Süddeutsche Bauzeitung, Nr. 31, 1905, S. 247 - 248
- Des Hauses Licht, Wärme und Kraft - Das Wirtschaftsbuch der modernen Hausfrau, Licht und Wärme Verlag Dessau, 1914, 90 S.
- Gaswerk. In: Adolf Schwammberger: Fürth von A bis Z. Ein Geschichtslexikon. Fürth: Selbstverlag der Stadt Fürth, 1968, S. 137
- Straßenbahn. In: Adolf Schwammberger: Fürth von A bis Z. Ein Geschichtslexikon. Fürth: Selbstverlag der Stadt Fürth, 1968, S. 350 f.
- Straßenbeleuchtung. In: Adolf Schwammberger: Fürth von A bis Z. Ein Geschichtslexikon. Fürth: Selbstverlag der Stadt Fürth, 1968, S. 351
- Stromversorgung. In: Adolf Schwammberger: Fürth von A bis Z. Ein Geschichtslexikon. Fürth: Selbstverlag der Stadt Fürth, 1968, S. 355 f.
- Wasserversorgung. In: Adolf Schwammberger: Fürth von A bis Z. Ein Geschichtslexikon. Fürth: Selbstverlag der Stadt Fürth, 1968, S. 385 f.
- Wasserhochbehälter und Omnibusbetriebshof. In: Amtsblatt der Stadt Fürth, Nr. 43, 10. Dezember 1976, S. 293, 296 - 298
- Omnibusbetriebshof vollendet und 75 Jahre Elektrizitätsversorgung in Fürth. In: Amtsblatt der Stadt Fürth, Nr. 39, 4. November 1977, S. 317 - 321 u. 325
- 75 Jahre Elektrizitätsversorgung in Fürth - Stadtwerke Fürth - 1977
- Omnibus Betriebshof Fürth - Stadtwerke Fürth - 1977
- 75 Jahre Gaswerk an der Leyher Straße - Stadtwerke Fürth - Juli 1982
- 25 Jahre Zweckverband zur Wasserversorgung des Knoblauchlandes, Eigenverlag des ZWK, 1982, 60 S.
- Wasser für Fürth - 100 Jahre Wasserversorgung - Stadtwerke Fürth - September 1985
- Barbara Ohm: Das alte Elektrizitätswerk. Eine Verlustanzeige. In: Fürther Heimatblätter, 1990/3, S.59 - 65
- 1857 - 1992: 135 Jahre Gasversorgung der Stadt Fürth - Stadtwerke Fürth - Mai 1992
- 100 Jahre Strom in Fürth - infra fürth gmbh - 2002
- Im Dienst am Kunden. die infra fürth Unternehmensgruppe. In: Auf in den Süden! Geschichte der Fürther Südstadt, 2017, Sandberg Verlag, ISBN 978-930699-94-0, S. 208 - 221
Lokalberichterstattung
- Laternen entzündet - 120 Jahre Gaslicht. In Fürther Nachrichten vom 23. August 1991 Seite 31 mit 3 historischen Fotos
- 580 Quadrratmeter große Photovoltaik Anlage auf dem Dach des Parkhauses in Betrieb genommen. In:Fürther Nachrichten vom 6. Juli 2006 (Druckausgabe)
- Die Stadt setzt konsequent auf Solarenergie – Bislang größte Fürther Photovoltaikanlage am Golfplatz eingeweiht In: Fürther Nachrichten vom 10. Januar 2007
- Volker Dittmar: Infra übernimmt die Regie in den Bädern - Mit Einstieg in die Betriebsgesellschaft soll die defizitäre Entwicklung aufgehalten werden. In: Fürther Nachrichten vom 03. Dezember 2009 - online
- Wolfgang Händel: Imposante Buszüge rollen künftig in Fürth - Infra setzt ab Februar drei Busse mit Anhängern ein - Mehr Platzkapazität und Flexibilität. In: Fürther Nachrichten vom 18. Januar 2010 - online
- Bäder bleiben bestehen. In: Fürther Nachrichten vom 13. Februar 2010
- Hans von Draminski: Schwere Entscheidung - ,Billig‘ ist bei Strom und Gas nicht unbedingt preiswert. In: Fürther Nachrichten vom 13. März 2010 - online
- Bauern unterstützen Biogas-Projekt der infra - Bereits über die Hälfte der benötigten Anbaufläche gesichert - Großanlage am Cadolzburger »Ohrwaschl«. In: Fürther Nachrichten vom 17. März 2010 - online
- Johannes Alles: Was man schon immer über Trinkwasser wissen wollte - Zum Tag des Wassers haben sich die Fürther Nachrichten über Brunnen, Aufbereitung und Verbrauchszahlen informiert. In: Fürther Nachrichten vom 23. März 2010 - online
- Hans von Draminski: Sicherer Strom aus riesigen Trafos - infra Fürth baut für acht Millionen Euro ein neues Umspannwerk in der Vacher Straße. In: Fürther Nachrichten vom 27. Mai 2010 - online
- Claudia Ziob: Fürther Trinkwasser ist jetzt vollständig chlorfrei. In: Fürther Nachrichten vom 01. Juni 2012 - online
- Volker Dittmar: Die infra baut neuen Wasserhochbehälter. In: Fürther Nachrichten vom 26. September 2012 - online
- Gabi Pfeiffer: Am Puls der Stadt. In: Fürther Nachrichten vom 3. September 2013 - online
- Claudia Ziob: Wasserpreis ist gesunken, Strom wird teurer. In: Fürther Nachrichten vom 20. November 2018 (Druckausgabe) bzw. Druck von oben: Trinkwasser in Fürth wird günstiger. In: nordbayern.de vom 20. November 2018 - online
- Volker Dittmar: Fürth löscht Cadolzburgs Durst. In: Fürther Nachrichten vom 24. April 2019 (Druckausgabe) bzw. nordbayern.de vom 25. April 2019 - online
- Volker Dittmar: Die Dampfleuchte hat ausgedient. In: Fürther Nachrichten vom 15. Oktober 2019 (Druckausgabe)
- Armin Leberzammer: Infra musste sich von der VAG abkoppeln. In: Fürther Nachrichten vom 6. Dezember 2019 (Druckausgabe) bzw. Notgedrungen: Infra musste sich von der VAG abkoppeln. In: nordbayern.de vom 6. Dezember 2019 - online
- Sabine Dietz: Wasserschutz hat absoluten Vorrang (Interview mit Stephan Zeilinger). In: Fürther Nachrichten vom 1. Mai 2020 (Druckausgabe)
- Stadt Fürth erneuert die Partnerschaft mit der infra. In: Fürth StadtZeitung, Nr. 01 vom 20. Januar 2021, S. 22 – PDF-Datei
- Und es wurde Licht: 200 Jahre öffentliche Beleuchtung. In: INFÜ, Nr. 22 vom 7. Dezember 2022, S. 28 – PDF-Datei
- Die Preise für Trinkwasser steigen kräftig. In: Fürther Nachrichten vom 13. November 2024 (Druckausgabe)
Siehe auch
- infra fürth holding gmbh
- E-Mobilität in Fürth
- Gaswerk
- Elektrizitätswerk
- Wasserhochbehälter
- Solarberg
- Solarwall (Golfplatz Fürth)
- Buslinien
- U-Bahn
- Straßenbahn
- M-net Telekommunikations GmbH
- Solarenergie-, Informations- und Demonstrationszentrum Solid GmbH
- Stadtentwässerung
- Verkehrsverbund Großraum Nürnberg GmbH
- Uhrenhäusla
- Das Eisenbahn- und Bus-Festival 2007
- Zweckverband zur Wasserversorgung des Knoblauchlandes
Weblinks
- infra fürth - online
- infra fürth - Wikipedia
- infra fürth - YouTube Kanal
- Fuhrpark der Infra Fürth (privat) - online
- Großkraftwerk Franken AG - Kraftwerk Franken I - online
- Franken Fernsehen: Fokus Fürth – Zu Besuch im Wasserwerk - online
Einzelnachweise
- ↑ Johannes Alles: Lieber infra-Chef als Bürgermeister. In: Fürther Nachrichten vom 13. Juli 2017 (Druckausgabe)
- ↑ Verwaltungsbericht des Technischen Betriebsamts; Jahresbericht des Städtischen Betriebsamts; Jahresbericht der Stadtwerke; Geschäftsbericht infra fürth gmbh; div. Jahrgänge
- ↑ Geschäftsbericht 2012 - infra fürth gmbh - S. 7
- ↑ Geschäftsberichte der infra fürth 1999 ff.
- ↑ 75 Jahre Elektrizitätsversorgung in Fürth - Stadtwerke Fürth - 1977
- ↑ 75 Jahre Elektrizitätsversorgung in Fürth - Stadtwerke Fürth - 1977
- ↑ 75 Jahre Elektrizitätsversorgung in Fürth - Stadtwerke Fürth - 1977
- ↑ Gabi Pfeiffer: bilder buch stadt fürth - Fürth, 2006, S.105
- ↑ Geschäftsbericht 2010 - infra fürth gmbh - S. 76
- ↑ Neues Bioenergiezentrum fast startklar. In: Fürther Nachrichten vom 05. August 2011
- ↑ Grüner Strom für weitere 1000 Haushalte. In: Marktspiegel vom 03. November 2011
- ↑ Geschäftsberichte der infra fürth 1999 ff.
- ↑ Geschäftsbericht der infra 2008, Seite 7
- ↑ Geschäftsbericht der infra 2008, Seite 10
- ↑ Geschäftsbericht der infra 2008, Seite 35
- ↑ 75 Jahre Gaswerk an der Leyher Straße - Stadtwerke Fürth - Juli 1982
- ↑ Geschäftsbericht der infra 2008, Seite 42
- ↑ Geschäftsbericht der infra 2008, Seite 43
- ↑ 75 Jahre Gaswerk an der Leyher Straße - Stadtwerke Fürth - Juli 1982
- ↑ Geschäftsberichte der infra fürth 1999 ff.
- ↑ Wasser für Fürth - 100 Jahre Wasserversorgung - Stadtwerke Fürth - September 1985
- ↑ Volker Dittmar: Die infra baut neuen Wasserhochbehälter. In: Fürther Nachrichten vom 25. September 2012
- ↑ Volker Dittmar: Neuer Wasserspeicher der Stadt Fürth fast fertig. In: Fürther Nachrichten vom 26. November 2014 - online
- ↑ Wasser für die Region, Herausgeber Zweckverband Wasserversorgung Fränkischer Wirtschaftsraum (WFW), abgerufen am 24.06.2018 - Die Fernleitung des WFW
- ↑ Wasser für Fürth - 100 Jahre Wasserversorgung - Stadtwerke Fürth - September 1985
- ↑ Reinhold Mücke: Wasser marsch! Kooperation mit infra Fürth erhöht Versorgungssicherheit im Gebiet des Zweckverbandes Brunnbach-Gruppe. In: Hilpoltsteiner Kurier vom 18. Juni 2015 - online
- ↑ Wasser für Fürth - 100 Jahre Wasserversorgung - Stadtwerke Fürth - September 1985
- ↑ Fürther Trinkwasser ist jetzt vollständig chlorfrei. In: Fürther Nachrichten vom 1. Juni 2012
- ↑ Volker Dittmar: Die infra baut neuen Wasserhochbehälter. In: Fürther Nachrichten vom 25. September 2012
- ↑ Volker Dittmar: Fürth löscht Cadolzburgs Durst. In: Fürther Nachrichten vom 24. April 2019
- ↑ Volker Dittmar: Großbaustelle mitten im Wald. In: Fürther Nachrichten vom 25. Oktober 2019 bzw. Großbaustelle im Fürther Stadtwald. In: nordbayern.de vom 26. Oktober 2019 - online
- ↑ Geschäftsberichte der infra fürth 1999 ff.
- ↑ "Handbuch für Kaufleute: für die Jahre 1785 und 1786", Band 1, Leipzig, 1786, S. 119. - online-Digitalisat
- ↑ Hermann Ott: Fürth zu Beginn des Industriezeitalters. Geschichtsverein Fürth, 1989, S. 29.
- ↑ Fürther Tagblatt, 2. Oktober 1858 online-Digitalisat der Bayerischen Staatsbibliothek
- ↑ Fürth 1887-1900, Käppner-Chronik, Teil 1. Hrsg: Bernd Jesussek, 2015, S. 37 und S. 52
- ↑ 75 Jahre Gaswerk an der Leyher Straße - Stadtwerke Fürth - Juli 1982
- ↑ Pressemitteilung der infra - online abrufbar [1]
- ↑ Pressemitteilung Stadt Fürth: Fürth leuchtet sparsam - Straßenbeleuchtung komplett auf LED umgerüstet – Bayernweit ganz vorn. BMPA 6. November 2024 / 359/24
- ↑ Volker Dittmar: Erster E-Bus Nordbayerns fährt in Fürth. In: Fürther Nachrichten vom 29. Januar 2018 - online
- ↑ Neue E-Busse als weiterer Baustein für die Verkehrswende. In: INFÜ, Nr. 10 vom 24. Mai 2023, S. 28 – PDF-Datei
Bilder
Bilder als Galerie / Tabelle anzeigen, sortieren und filtern
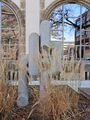
Brunnen des Künstlers Heinz Siebenkäß vor dem ehemaligen Verwaltungsgebäude der Stadtwerke, November ... Brunnen des Künstlers Heinz Siebenkäß vor dem ehemaligen Verwaltungsgebäude der Stadtwerke, November 2025
Urheber: LadyJ
Lizenz: copyright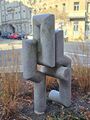
Brunnen des Künstlers Heinz Siebenkäß vor dem ehemaligen Verwaltungsgebäude der Stadtwerke, November ... Brunnen des Künstlers Heinz Siebenkäß vor dem ehemaligen Verwaltungsgebäude der Stadtwerke, November 2025
Urheber: Archiv LadyJ
Lizenz: copyright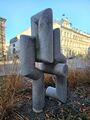
Brunnen des Künstlers Heinz Siebenkäß vor dem ehemaligen Verwaltungsgebäude der Stadtwerke, November ... Brunnen des Künstlers Heinz Siebenkäß vor dem ehemaligen Verwaltungsgebäude der Stadtwerke, November 2025
Urheber: LadyJ
Lizenz: copyright
Brunnen am Wasserwerk an der Dianastraße, geschaffen von Heinz Siebenkäß, Oktober 2025 Urheber: LadyJ
Lizenz: copyright
Blick vom U-Bahn-Zugang an der Kapellenstraße in den U-Bahnhof Stadthalle, Juni 2025 Urheber: Web Trefoil
Lizenz: CC BY-SA 4.0
Einkaufstasche Stadtwerke Fürth Urheber: Claus W. Vogl
Lizenz: CC BY-SA 4.0
OB Dr. Thomas Jung und infra-Geschäftsführer beim Austausch der letzten ... OB Dr. Thomas Jung und infra-Geschäftsführer beim Austausch der letzten Natrium-Dampfhochdruck-Leuchte in der Marienstraße durch modernere LED-Lampen, Nov 2024
Urheber: infra fürth gmbh
Lizenz: copyright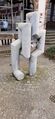
Beschädigte Brunnenskulptur (stilisierte Rohrleitungen) des Künstlers Heinz Siebenkäß vor dem ... Beschädigte Brunnenskulptur (stilisierte Rohrleitungen) des Künstlers Heinz Siebenkäß vor dem ehemaligen Verwaltungsgebäude der Stadtwerke, Zustand März 2024 (das abgebrochene Teil gilt als verschollen)
Urheber: Dembowa
Lizenz: CC BY-SA 3.0
Ehemaliges Verwaltungsgebäude der Stadtwerke. Platzartige Erweiterung mit Brunnen des Künstlers ... Ehemaliges Verwaltungsgebäude der Stadtwerke. Platzartige Erweiterung mit Brunnen des Künstlers Heinz Siebenkäß an der Ottostraße vor geplanter Neugestaltung.
Urheber: Dembowa
Lizenz: CC BY-SA 3.0
Beschädigte Brunnenskulptur (stilisierte Rohrleitungen) des Künstlers Heinz Siebenkäß vor dem ... Beschädigte Brunnenskulptur (stilisierte Rohrleitungen) des Künstlers Heinz Siebenkäß vor dem ehemaligen Verwaltungsgebäude der Stadtwerke, Zustand März 2024. Im HIntergrund Häuser der Theresienstraße
Urheber: Dembowa
Lizenz: CC BY-SA 3.0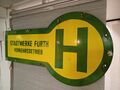
Bushaltestellenschild der ehem. Stadtwerke Fürth Urheber: Ralph Stenzel
Lizenz: CC BY-SA 3.0
Deckenelement im Service-Center der infra im sanierten Hauptbahnhof, März 2023 Urheber: Web Trefoil
Lizenz: CC BY-SA 3.0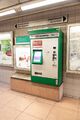
Fahrkartenautomat der VAG/infra für den öffentlichen Nahverkehr, Dez. 2022 Urheber: Kamran Salimi
Lizenz: CC BY-SA 3.0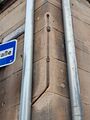
Einer der ganz wenigen noch vorhandenen Gasleitungen für die Straßenbeleuchtung an der Theaterstraße ... Einer der ganz wenigen noch vorhandenen Gasleitungen für die Straßenbeleuchtung an der Theaterstraße 20 (Ecke zur Blumenstraße), erhalten und herausgearbeitet vom Steinmetzbetrieb Peter Stutzmann
Urheber: Alexander Mayer
Lizenz: CC BY-SA 3.0
Prospekt: ... Prospekt: ZukunftsWerk. Verkaufsprospekt zum qualifizierten Nachrang-Darlehen der infra fürth gmbh, 2022
Urheber: infra fürth gmbh
Lizenz: copyright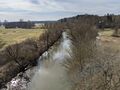
Die Rednitz und die Grundwasserbrunnen der infra in der Nähe des Kellerwegs im Februar 2022. Urheber: Web Trefoil
Lizenz: CC BY-SA 3.0
Werbung Stadtwerke weihnachtlicher kostenloser ÖPV 2022 Urheber: Infra fürth
Lizenz: copyright
Schalthaus Stiftungsstraße, Männerskulptur mit Glühbirne, Feb. 2021 Urheber: Kamran Salimi
Lizenz: CC BY-SA 3.0
Schalthaus Stiftungsstraße, Männerskulptur mit Glühbirne, Feb. 2021 Urheber: Kamran Salimi
Lizenz: CC BY-SA 3.0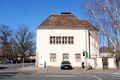
Schalthaus Stiftungsstraße von Süden aus betrachtet, Feb. 2021 Urheber: Kamran Salimi
Lizenz: CC BY-SA 3.0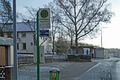
Wasserwerk Knoblauchsland der infra in Mannhof, Jan. 2021 Urheber: Web Trefoil
Lizenz: CC BY-SA 3.0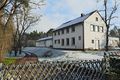
Wasserwerk Knoblauchsland der infra in Mannhof, Jan. 2021 Urheber: Web Trefoil
Lizenz: CC BY-SA 3.0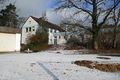
Wasserwerk Knoblauchsland der infra in Mannhof, Jan. 2021 Urheber: Web Trefoil
Lizenz: CC BY-SA 3.0
Wasserwerk Knoblauchsland der infra in Mannhof, Jan. 2021 Urheber: Web Trefoil
Lizenz: CC BY-SA 3.0
U-Bahnhof Rathaus Urheber: Marcus Weier
Lizenz: CC BY-SA 3.0
Heizwerk Dambach (HW2) der Unternehmensgruppe infra GmbH, Aug. 2020 Urheber: Kamran Salimi
Lizenz: CC BY-SA 3.0
Heizwerk Dambach (HW2) der Unternehmensgruppe infra GmbH, Aug. 2020 Urheber: Kamran Salimi
Lizenz: CC BY-SA 3.0
Blick über den Wasserhochbehälter Katzenstein der infra im Stadtwald in Oberfürberg in der Nähe des ... Blick über den Wasserhochbehälter Katzenstein der infra im Stadtwald in Oberfürberg in der Nähe des ehem. Waldkrankenhauses, Aug. 2020
Urheber: Kamran Salimi
Lizenz: CC BY-SA 3.0
Das Fürther Unternehmen infra fürth gmbh in der Leyher Straße, Juni 2020 Lizenz: CC BY-SA 3.0
Sitz der infra fürth holding gmbh in der Leyher Straße Lizenz: CC BY-SA 3.0
Das Fürther Unternehmen infra fürth gmbh in der Leyher Straße, Juni 2020 Lizenz: CC BY-SA 3.0
Das Fürther Unternehmen infra fürth gmbh in der Leyher Straße, Juni 2020 Lizenz: CC BY-SA 3.0
Das Fürther Unternehmen infra fürth gmbh in der Leyher Straße, Juni 2020 Lizenz: CC BY-SA 3.0
Aufstellen einer 20 kV-Ortsnetz-Trafostation in Betonfertigbauweise, März 2020 Urheber: S. Schober, Fürth
Lizenz: CC BY-SA 3.0
Urheber: Marcus Weier
Lizenz: CC BY-NC-SA 3.0
Werbung Stadtwerke weihnachtlicher kostenloser ÖPV 2019 Urheber: Infra Fürth
Lizenz: copyright
Marcus Steurer, 2018 Urheber: Jurga Graf (photo-graf.de)
Lizenz: copyright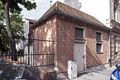
Trafostation der infra fürth, Amalienstr. 12 Urheber: Robert Söllner
Trafostation am Schießplatz, Zustand Mai 2018 Urheber: Doc Bendit
Lizenz: CC BY-SA 3.0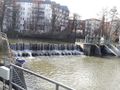
Stauwehr der Förstermühle, heute als Wasserkraftwerk der infra fürth genutzt Urheber: Michael Krauß
Lizenz: CC BY-SA 3.0
Schalthaus Stiftungsstraße, Detail Urheber: Kamran Salimi
Lizenz: CC BY-SA 3.0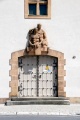
Schalthaus Stiftungsstraße, Eingangsportal Urheber: Kamran Salimi
Lizenz: CC BY-SA 3.0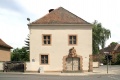
Schalthaus Stiftungstraße Urheber: Kamran Salimi
Lizenz: CC BY-SA 3.0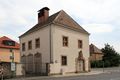
Schalthaus Stiftungstraße 41 Urheber: Kamran Salimi
Lizenz: CC BY-SA 3.0
Haupteingang der infra fürth gmbh, Leyher Straße 69. Im Hintergrund der denkmalgeschützte ehemalige ... Haupteingang der infra fürth gmbh, Leyher Straße 69. Im Hintergrund der denkmalgeschützte ehemalige Wasserturm
Urheber: Cybrarian
Lizenz: CC BY-SA 3.0
Broschüre 100 Jahre Abfallwirtschaft Fürth - Titelseite Urheber: Stadt Fürth, Amt für Abfallwirtschaft
Lizenz: Copyright
2009 abgerissener 20kV-Schaltanlagentrakt des alten Umspannwerks U4. Urheber: Ralph Stenzel
Lizenz: CC BY-SA 3.0
Rundbrief Nr. 37 (8. August 2008) von Alexander Mayer. Urheber: Alexander Mayer
Lizenz: copyright
Begehung des alten Umspannwerks U4.Teilnehmer: Ralph Roeder von der Unteren Denkmalschutzbehörde, ... Begehung des alten Umspannwerks U4.Teilnehmer: Ralph Roeder von der Unteren Denkmalschutzbehörde, Mitglieder des Arbeitskreises Kunst im öffentlichen Raum und Stadtheimatpfleger Alexander Mayer
Urheber: Alexander Mayer
Lizenz: CC BY-SA 3.0
Begehung des alten Umspannwerks U4. Teilnehmer: Ralph Roeder von der Unteren Denkmalschutzbehörde, ... Begehung des alten Umspannwerks U4. Teilnehmer: Ralph Roeder von der Unteren Denkmalschutzbehörde, Mitglieder des Arbeitskreises Kunst im öffentlichen Raum und Stadtheimatpfleger Alexander Mayer
Urheber: Alexander Mayer
Lizenz: CC BY-SA 3.0
Begehung des alten Umspannwerks U4.Teilnehmer: Ralph Roeder von der Unteren Denkmalschutzbehörde, ... Begehung des alten Umspannwerks U4.Teilnehmer: Ralph Roeder von der Unteren Denkmalschutzbehörde, Mitglieder des Arbeitskreises Kunst im öffentlichen Raum und Stadtheimatpfleger Alexander Mayer
Urheber: Alexander Mayer
Lizenz: CC BY-SA 3.0
Der U-Bahnhof Rathaus. Urheber: Felix Geismann
Lizenz: CC BY-SA 3.0
Urheber: Andy
Lizenz: CC BY-SA 3.0
Erinnerungsfahrschein 1. Fahrt der U 1 zwischen U-Bahnhof Klinikum bis U-Bahnhof Hardhöhe am ... Erinnerungsfahrschein 1. Fahrt der U 1 zwischen U-Bahnhof Klinikum bis U-Bahnhof Hardhöhe am 8.12.2007
Urheber: Klaus-Peter Schaack
Lizenz: CC BY-SA 3.0
Anzeigentafel im U-Bahnhof Klinikum zur 1. Fahrt der U 1 zum neuen U-Bahnhof Hardhöhe am ... Anzeigentafel im U-Bahnhof Klinikum zur 1. Fahrt der U 1 zum neuen U-Bahnhof Hardhöhe am Eröffnungstag, 8.12.2007
Urheber: Klaus-Peter Schaack
Lizenz: CC BY-SA 3.0
Mosaik Wandbild im U-Bahnhof Jakobinenstraße von Iris Rauh im Dezember 2007 Urheber: Klaus-Peter Schaack
Lizenz: CC BY-SA 3.0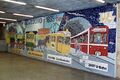
Mosaik Wandbild im U-Bahnhof Jakobinenstraße von Iris Rauh im Dezember 2007 Urheber: Klaus-Peter Schaack
Lizenz: CC BY-SA 3.0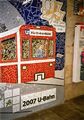
Mosaik Wandbild Triebwagen DT1 mit Zielschild U-Bahnhof Hardhöhe im U-Bahnhof Jakobinenstraße von ... Mosaik Wandbild Triebwagen DT1 mit Zielschild U-Bahnhof Hardhöhe im U-Bahnhof Jakobinenstraße von Iris Rauh im Dezember 2007
Urheber: Klaus-Peter Schaack
Lizenz: CC BY-SA 3.0
steinerne Signatur der Künstlerin Iris Rauh neben ihren Mosaik Wandbild im U-Bahnhof Jakobinenstraße ... steinerne Signatur der Künstlerin Iris Rauh neben ihren Mosaik Wandbild im U-Bahnhof Jakobinenstraße im Dezember 2007
Urheber: Klaus-Peter Schaack
Lizenz: CC BY-SA 3.0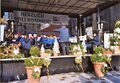
die Straßenbahnerkapelle spielt auf zur Eröffnung des U-Bahnhof Hardhöhe am 8.12.2007 Urheber: Klaus-Peter Schaack
Lizenz: CC BY-SA 3.0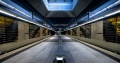
U-Bahnstation Hardhöhe Urheber: Johannes Heuckeroth, http://pfnphoto.com
Lizenz: CC BY-SA 3.0
Eingang zur U-Bahnstation Fürth-Hardhöhe Urheber: Magnus Gertkemper
Lizenz: CC BY-SA 3.0
Eisenbahn- und Busfestival 15.-16.9.2007 im Infra- und Bahn Gelände an der Karolinenstraße der ... Eisenbahn- und Busfestival 15.-16.9.2007 im Infra- und Bahn Gelände an der Karolinenstraße der "Eisenbahnstadt Fürth"
Urheber: Norbert Pietsch
Lizenz: CC BY-SA 3.0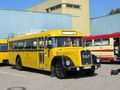
Eisenbahn- und Busfestival 15.-16.9.2007 im Infra- und Bahn Gelände an der Karolinenstraße der ... Eisenbahn- und Busfestival 15.-16.9.2007 im Infra- und Bahn Gelände an der Karolinenstraße der "Eisenbahnstadt Fürth"
Urheber: Norbert Pietsch
Lizenz: CC BY-SA 3.0
Eisenbahn- und Busfestival 15.-16.9.2007 im Infra- und Bahn Gelände an der Karolinenstraße der ... Eisenbahn- und Busfestival 15.-16.9.2007 im Infra- und Bahn Gelände an der Karolinenstraße der "Eisenbahnstadt Fürth"
Urheber: Norbert Pietsch
Lizenz: CC BY-SA 3.0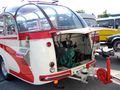
Eisenbahn- und Busfestival 15.-16.9.2007 im Infra- und Bahn Gelände an der Karolinenstraße der ... Eisenbahn- und Busfestival 15.-16.9.2007 im Infra- und Bahn Gelände an der Karolinenstraße der "Eisenbahnstadt Fürth"
Urheber: Norbert Pietsch
Lizenz: CC BY-SA 3.0
Eisenbahn- und Busfestival 15.-16.9.2007 im Infra- und Bahn Gelände an der Karolinenstraße der ... Eisenbahn- und Busfestival 15.-16.9.2007 im Infra- und Bahn Gelände an der Karolinenstraße der "Eisenbahnstadt Fürth"
Urheber: Norbert Pietsch
Lizenz: CC BY-SA 3.0
Eisenbahn- und Busfestival 15.-16.9.2007 im Infra- und Bahn Gelände an der Karolinenstraße der ... Eisenbahn- und Busfestival 15.-16.9.2007 im Infra- und Bahn Gelände an der Karolinenstraße der "Eisenbahnstadt Fürth"
Urheber: Norbert Pietsch
Lizenz: CC BY-SA 3.0
Eisenbahn- und Busfestival 15.-16.9.2007 im Infra- und Bahn Gelände an der Karolinenstraße der ... Eisenbahn- und Busfestival 15.-16.9.2007 im Infra- und Bahn Gelände an der Karolinenstraße der "Eisenbahnstadt Fürth". Interessantes Detail - der Mercedes Stern...
Urheber: Norbert Pietsch
Lizenz: CC BY-SA 3.0
Eisenbahn- und Busfestival 15.-16.9.2007 im Infra- und Bahn Gelände an der Karolinenstraße der ... Eisenbahn- und Busfestival 15.-16.9.2007 im Infra- und Bahn Gelände an der Karolinenstraße der "Eisenbahnstadt Fürth"
Urheber: Norbert Pietsch
Lizenz: CC BY-SA 3.0
Eisenbahn- und Busfestival 15.-16.9.2007 im Infra- und Bahn Gelände an der Karolinenstraße der ... Eisenbahn- und Busfestival 15.-16.9.2007 im Infra- und Bahn Gelände an der Karolinenstraße der "Eisenbahnstadt Fürth"
Urheber: Norbert Pietsch
Lizenz: CC BY-SA 3.0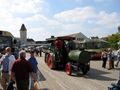
Eisenbahn- und Busfestival 15.-16.9.2007 im Infra- und Bahn Gelände an der Karolinenstraße der ... Eisenbahn- und Busfestival 15.-16.9.2007 im Infra- und Bahn Gelände an der Karolinenstraße der "Eisenbahnstadt Fürth"
Urheber: Norbert Pietsch
Lizenz: CC BY-SA 3.0
Eisenbahn- und Busfestival 15.-16.9.2007 im Infra- und Bahn Gelände an der Karolinenstraße der ... Eisenbahn- und Busfestival 15.-16.9.2007 im Infra- und Bahn Gelände an der Karolinenstraße der "Eisenbahnstadt Fürth"
Urheber: Norbert Pietsch
Lizenz: CC BY-SA 3.0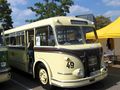
Eisenbahn- und Busfestival 15.-16.9.2007 im Infra- und Bahn Gelände an der Karolinenstraße der ... Eisenbahn- und Busfestival 15.-16.9.2007 im Infra- und Bahn Gelände an der Karolinenstraße der "Eisenbahnstadt Fürth"
Urheber: Norbert Pietsch
Lizenz: CC BY-SA 3.0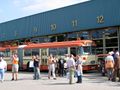
Eisenbahn- und Busfestival 15.-16.9.2007 im Infra- und Bahn Gelände an der Karolinenstraße der ... Eisenbahn- und Busfestival 15.-16.9.2007 im Infra- und Bahn Gelände an der Karolinenstraße der "Eisenbahnstadt Fürth"
Urheber: Norbert Pietsch
Lizenz: CC BY-SA 3.0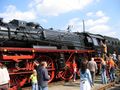
Eisenbahn- und Busfestival 15.-16.9.2007 im Infra- und Bahn Gelände an der Karolinenstraße der ... Eisenbahn- und Busfestival 15.-16.9.2007 im Infra- und Bahn Gelände an der Karolinenstraße der "Eisenbahnstadt Fürth"
Urheber: Norbert Pietsch
Lizenz: CC BY-SA 3.0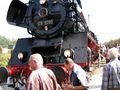
Eisenbahn- und Busfestival 15.-16.9.2007 im Infra- und Bahn Gelände an der Karolinenstraße der ... Eisenbahn- und Busfestival 15.-16.9.2007 im Infra- und Bahn Gelände an der Karolinenstraße der "Eisenbahnstadt Fürth"
Urheber: Norbert Pietsch
Lizenz: CC BY-SA 3.0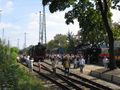
Eisenbahn- und Busfestival 15.-16.9.2007 im Infra- und Bahn Gelände an der Karolinenstraße der ... Eisenbahn- und Busfestival 15.-16.9.2007 im Infra- und Bahn Gelände an der Karolinenstraße der "Eisenbahnstadt Fürth"
Urheber: Norbert Pietsch
Lizenz: CC BY-SA 3.0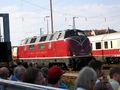
Eisenbahn- und Busfestival 15.-16.9.2007 im Infra- und Bahn Gelände an der Karolinenstraße der ... Eisenbahn- und Busfestival 15.-16.9.2007 im Infra- und Bahn Gelände an der Karolinenstraße der "Eisenbahnstadt Fürth"
Urheber: Norbert Pietsch
Lizenz: CC BY-SA 3.0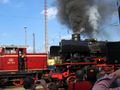
Eisenbahn- und Busfestival 15.-16.9.2007 im Infra- und Bahn Gelände an der Karolinenstraße der ... Eisenbahn- und Busfestival 15.-16.9.2007 im Infra- und Bahn Gelände an der Karolinenstraße der "Eisenbahnstadt Fürth"
Urheber: Norbert Pietsch
Lizenz: CC BY-SA 3.0
Eisenbahn- und Busfestival 15.-16.9.2007 im Infra- und Bahn Gelände an der Karolinenstraße der ... Eisenbahn- und Busfestival 15.-16.9.2007 im Infra- und Bahn Gelände an der Karolinenstraße der "Eisenbahnstadt Fürth"
Urheber: Norbert Pietsch
Lizenz: CC BY-SA 3.0
Eisenbahn- und Busfestival 15.-16.9.2007 im Infra- und Bahn Gelände an der Karolinenstraße der ... Eisenbahn- und Busfestival 15.-16.9.2007 im Infra- und Bahn Gelände an der Karolinenstraße der "Eisenbahnstadt Fürth"
Urheber: Norbert Pietsch
Lizenz: CC BY-SA 3.0
Eisenbahn- und Busfestival 15.-16.9.2007 im Infra- und Bahn Gelände an der Karolinenstraße der ... Eisenbahn- und Busfestival 15.-16.9.2007 im Infra- und Bahn Gelände an der Karolinenstraße der "Eisenbahnstadt Fürth"
Urheber: Norbert Pietsch
Lizenz: CC BY-SA 3.0
Eisenbahn- und Busfestival 15.-16.9.2007 im Infra- und Bahn Gelände an der Karolinenstraße der ... Eisenbahn- und Busfestival 15.-16.9.2007 im Infra- und Bahn Gelände an der Karolinenstraße der "Eisenbahnstadt Fürth". Eine der 15 historischen Lokomotiven incl. dem Adler Nachbau von 1935, die am 17.10.2005 im Ringlokschuppen Nürnberg-West an der Jansenbrücke mit verbannte.
Urheber: Norbert Pietsch
Lizenz: CC BY-SA 3.0
Eisenbahn- und Busfestival 15.-16.9.2007 im Infra- und Bahn Gelände an der Karolinenstraße der ... Eisenbahn- und Busfestival 15.-16.9.2007 im Infra- und Bahn Gelände an der Karolinenstraße der "Eisenbahnstadt Fürth"
Urheber: Norbert Pietsch
Lizenz: CC BY-SA 3.0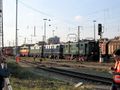
Eisenbahn- und Busfestival 15.-16.9.2007 im Infra- und Bahn Gelände an der Karolinenstraße der ... Eisenbahn- und Busfestival 15.-16.9.2007 im Infra- und Bahn Gelände an der Karolinenstraße der "Eisenbahnstadt Fürth"
Urheber: Norbert Pietsch
Lizenz: CC BY-SA 3.0
Eisenbahn- und Busfestival 15.-16.9.2007 im Infra- und Bahn Gelände an der Karolinenstraße der ... Eisenbahn- und Busfestival 15.-16.9.2007 im Infra- und Bahn Gelände an der Karolinenstraße der "Eisenbahnstadt Fürth"
Urheber: Norbert Pietsch
Lizenz: CC BY-SA 3.0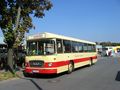
Eisenbahn- und Busfestival 15.-16.9.2007 im Infra- und Bahn Gelände an der Karolinenstraße der ... Eisenbahn- und Busfestival 15.-16.9.2007 im Infra- und Bahn Gelände an der Karolinenstraße der "Eisenbahnstadt Fürth"
Urheber: Norbert Pietsch
Lizenz: CC BY-SA 3.0
Eisenbahn- und Busfestival 15.-16.9.2007 im Infra- und Bahn Gelände an der Karolinenstraße der ... Eisenbahn- und Busfestival 15.-16.9.2007 im Infra- und Bahn Gelände an der Karolinenstraße der "Eisenbahnstadt Fürth"
Urheber: Norbert Pietsch
Lizenz: CC BY-SA 3.0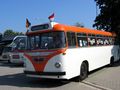
Eisenbahn- und Busfestival 15.-16.9.2007 im Infra- und Bahn Gelände an der Karolinenstraße der ... Eisenbahn- und Busfestival 15.-16.9.2007 im Infra- und Bahn Gelände an der Karolinenstraße der "Eisenbahnstadt Fürth"
Urheber: Norbert Pietsch
Lizenz: CC BY-SA 3.0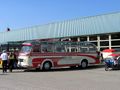
Eisenbahn- und Busfestival 15.-16.9.2007 im Infra- und Bahn Gelände an der Karolinenstraße der ... Eisenbahn- und Busfestival 15.-16.9.2007 im Infra- und Bahn Gelände an der Karolinenstraße der "Eisenbahnstadt Fürth"
Urheber: Norbert Pietsch
Lizenz: CC BY-SA 3.0
Eisenbahn- und Busfestival 15.-16.9.2007 im Infra- und Bahn Gelände an der Karolinenstraße der ... Eisenbahn- und Busfestival 15.-16.9.2007 im Infra- und Bahn Gelände an der Karolinenstraße der "Eisenbahnstadt Fürth"
Urheber: Norbert Pietsch
Lizenz: CC BY-SA 3.0
Straßenbahn Gedenkstein an der ehemaligen Straßenbahn Wendeschleife Billinganlage im Juli 2007 Urheber: Klaus-Peter Schaack
Lizenz: CC BY-SA 3.0
U-Bahnhof Fürth Klinikum. Urheber: Achates
Lizenz: CC BY-SA 3.0
Dr. Hans Partheimüller, 2007 Urheber: Bay. Motoryachtverein e V.
Lizenz: Copyright
Ehemalige Trafostation der Stadtwerke, Lange Str./Ecke Meckstraße Urheber: Doc Bendit
Lizenz: CC BY-SA 3.0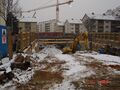
Bau der U-Bahn auf der Hardhöhe (Januar 2006) Urheber: Wolfgang Wondrak
Lizenz: CC BY-SA 3.0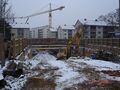
Bau der U-Bahn auf der Hardhöhe (Januar 2006) Urheber: Wolfgang Wondrak
Lizenz: CC BY-SA 3.0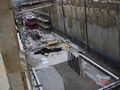
Bau der U-Bahn auf der Hardhöhe (Januar 2006) Urheber: Wolfgang Wondrak
Lizenz: CC BY-SA 3.0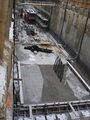
Bau der U-Bahn auf der Hardhöhe (Januar 2006) Urheber: Wolfgang Wondrak
Lizenz: CC BY-SA 3.0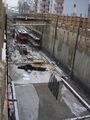
Bau der U-Bahn auf der Hardhöhe (Januar 2006) Urheber: Wolfgang Wondrak
Lizenz: CC BY-SA 3.0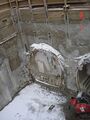
Bau der U-Bahn auf der Hardhöhe (Januar 2006) Urheber: Wolfgang Wondrak
Lizenz: CC BY-SA 3.0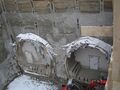
Bau der U-Bahn auf der Hardhöhe (Januar 2006) Urheber: Wolfgang Wondrak
Lizenz: CC BY-SA 3.0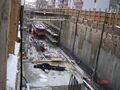
Bau der U-Bahn auf der Hardhöhe (Januar 2006) Urheber: Wolfgang Wondrak
Lizenz: CC BY-SA 3.0
Bau der U-Bahn auf der Hardhöhe (Januar 2006) Urheber: Wolfgang Wondrak
Lizenz: CC BY-SA 3.0
Bau der U-Bahn auf der Hardhöhe (November 2005) Urheber: Wolfgang Wondrak
Lizenz: CC BY-SA 3.0
Bau der U-Bahn auf der Hardhöhe (November 2005) Urheber: Wolfgang Wondrak
Lizenz: CC BY-SA 3.0
Bau der U-Bahn auf der Hardhöhe (November 2005) Urheber: Wolfgang Wondrak
Lizenz: CC BY-SA 3.0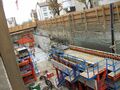
Bau der U-Bahn auf der Hardhöhe (November 2005) Urheber: Wolfgang Wondrak
Lizenz: CC BY-SA 3.0
Bau der U-Bahn auf der Hardhöhe (November 2005) Urheber: Wolfgang Wondrak
Lizenz: CC BY-SA 3.0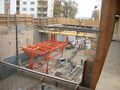
Bau der U-Bahn auf der Hardhöhe (November 2005) Urheber: Wolfgang Wondrak
Lizenz: CC BY-SA 3.0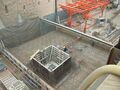
Bau der U-Bahn auf der Hardhöhe (November 2005) Urheber: Wolfgang Wondrak
Lizenz: CC BY-SA 3.0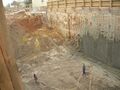
Bau der U-Bahn auf der Hardhöhe (November 2005) Urheber: Wolfgang Wondrak
Lizenz: CC BY-SA 3.0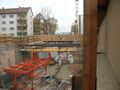
Bau der U-Bahn auf der Hardhöhe (November 2005) Urheber: Wolfgang Wondrak
Lizenz: CC BY-SA 3.0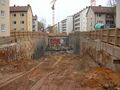
Bau der U-Bahn auf der Hardhöhe (November 2005) Urheber: Wolfgang Wondrak
Lizenz: CC BY-SA 3.0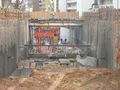
Bau der U-Bahn auf der Hardhöhe (November 2005) Urheber: Wolfgang Wondrak
Lizenz: CC BY-SA 3.0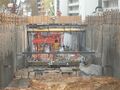
Bau der U-Bahn auf der Hardhöhe (November 2005) Urheber: Wolfgang Wondrak
Lizenz: CC BY-SA 3.0
Bau der U-Bahn auf der Hardhöhe (November 2005) Urheber: Wolfgang Wondrak
Lizenz: CC BY-SA 3.0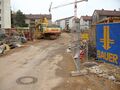
Bau der U-Bahn auf der Hardhöhe (November 2005) Urheber: Wolfgang Wondrak
Lizenz: CC BY-SA 3.0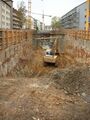
Bau der U-Bahn auf der Hardhöhe (November 2005) Urheber: Wolfgang Wondrak
Lizenz: CC BY-SA 3.0
Bau der U-Bahn auf der Hardhöhe (November 2005) Urheber: Wolfgang Wondrak
Lizenz: CC BY-SA 3.0
Bau der U-Bahn auf der Hardhöhe (November 2005) Urheber: Wolfgang Wondrak
Lizenz: CC BY-SA 3.0
Bautafel der Tief Bohrungen für das geplante Thermalbad Fürthermare im Mai 2005 Urheber: Klaus-Peter Schaack
Lizenz: CC BY-SA 3.0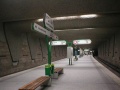
Lizenz: CC BY-SA 3.0
Nachkriegskunst am U-Bahnhof Klinikum. Urheber: Kamran Salimi
Lizenz: CC BY-SA 3.0
Flyer der Infra Fürth zur Eröffnung des U-Bahnhofs Klinikum am 4. Dezember 2004 Urheber: Infra Fürth
Lizenz: copyright
Probebohrungen für das geplante Thermalbad Fürthermare im Oktober 2004 Urheber: Klaus-Peter Schaack
Lizenz: CC BY-SA 3.0
Bauarbeiten am U-Bahnhof Klinikum. Urheber: Ger1axg
Lizenz: GFDL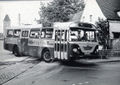
MAN Siemens 301 300 302 Büssing Präfekt 12 D, Baujahr 1969 Urheber: unbekannt
Lizenz: CC BY-SA 3.0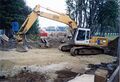
Kanalarbeiten "Schacht D" Regenrückhaltebecken in der Vacher Straße, Käppnerweg und Wiesengrund im ... Kanalarbeiten "Schacht D" Regenrückhaltebecken in der Vacher Straße, Käppnerweg und Wiesengrund im Oktober 2003
Urheber: Klaus-Peter Schaack
Lizenz: CC BY-SA 3.0
Kanalarbeiten "Schacht D" in der Vacher Straße im September 2003 Urheber: Klaus-Peter Schaack
Lizenz: CC BY-SA 3.0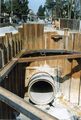
Kanalarbeiten "Schacht D" in der Vacher Straße im April 2003 Urheber: Klaus-Peter Schaack
Lizenz: CC BY-SA 3.0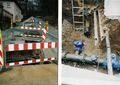
Rohrleitungsarbeiten in der Vacher- und Jakob-Henle-Straße im März 2003 Urheber: Klaus-Peter Schaack
Lizenz: CC BY-SA 3.0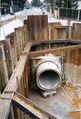
Kanalarbeiten "Schacht D" in der Vacher Straße im März 2003 Urheber: Klaus-Peter Schaack
Lizenz: CC BY-SA 3.0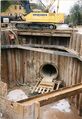
Kanalarbeiten "Schacht D" in der Vacher Straße im März 2003 Urheber: Klaus-Peter Schaack
Lizenz: CC BY-SA 3.0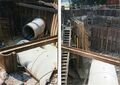
Kanalarbeiten "Schacht D" in der Vacher Straße im März 2003 Urheber: Klaus-Peter Schaack
Lizenz: CC BY-SA 3.0
Broschüre 100 Jahre Strom in Fürth - Titelseite Urheber: Stadtwerke
Lizenz: Copyright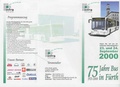
Flyer 75 Jahre Bus in Fürth 1925 - 2000 Urheber: Infra fürth gmbh
Lizenz: CC BY-SA 3.0
Das Logo infra Fürth von 1999 - 2017 Urheber: Stadt Fürth
Lizenz: copyright
Titelseite einer Ausgabe der ehemaligen internen Mitarbeiterzeitung "Werksgeflüster" der Stadtwerke ... Titelseite einer Ausgabe der ehemaligen internen Mitarbeiterzeitung "Werksgeflüster" der Stadtwerke von 1998
Urheber: Stadtwerke
Lizenz: Copyright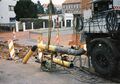
neue Gasleitung Verlegung in der Jakob-Henle-Straße zur Vacher Straße aus im März 1998 Urheber: Klaus-Peter Schaack
Lizenz: CC BY-SA 3.0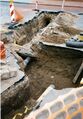
neue Gasleitung Verlegung in der Jakob-Henle-Straße zur Vacher Straße aus im März 1998 Urheber: Klaus-Peter Schaack
Lizenz: CC BY-SA 3.0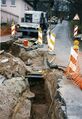
neue Gasleitung Verlegung in der Jakob-Henle-Straße zur Vacher Straße aus im März 1998 Urheber: Klaus-Peter Schaack
Lizenz: CC BY-SA 3.0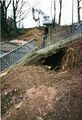
neue Gasleitung Verlegung am Treppenaufgang zum Klinikum Fürth an der Jakob-Henle-Straße im Februar ... neue Gasleitung Verlegung am Treppenaufgang zum Klinikum Fürth an der Jakob-Henle-Straße im Februar 1998
Urheber: Klaus-Peter Schaack
Lizenz: CC BY-SA 3.0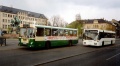
Linie 179 und 177 am Fürther Hauptbahnhof Lizenz: CC BY-SA 3.0
Werbung aus dem Jahre 1996 Urheber: Stadtwerke Fürth
Lizenz: CC BY-SA 3.0
Werbung im Jahre 1996 Urheber: Zweckverband
Lizenz: CC BY-SA 3.0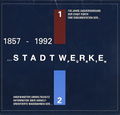
Broschüre 1857 - 1992. 135 Jahre Gasversorgung der Stadt Fürth - Titelseite Urheber: Stadtwerke
Lizenz: Copyright
Anzeige der Stadtwerke Fürth aus einem Fürther Stadtplan (1990) Urheber: Der dude
Lizenz: CC BY-SA 3.0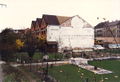
Elektrizitätswerk, Südseite des östlichen Erweiterungsbaus, im Hintergrund Häuser der ... Elektrizitätswerk, Südseite des östlichen Erweiterungsbaus, im Hintergrund Häuser der Theresienstraße, 1990
Urheber: Reinhard Thielsch
Lizenz: CC BY-SA 3.0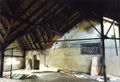
Elektrizitätswerk, Dachgeschoss des östlichen Anbaus, steinernes Wandbild an der ursprünglichen ... Elektrizitätswerk, Dachgeschoss des östlichen Anbaus, steinernes Wandbild an der ursprünglichen Außemnauer des Mitteltrakts "St. Elektrizitätswerk Fürth", feuerspeiender Drachenkopf mit zwei Leitungsenden, 1990
Urheber: Reinhard Thielsch
Lizenz: CC BY-SA 3.0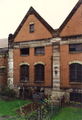
Elektrizitätswerk, Südseite des östlichen Erweiterungsbaus, Detail, 1990 Urheber: Reinhard Thielsch
Lizenz: CC BY-SA 3.0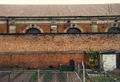
Elektrizitätswerk, Südseite des Mittelbaus mit Abgrenzungsmauer zum Bahngelände, 1990 Urheber: Reinhard Thielsch
Lizenz: CC BY-SA 3.0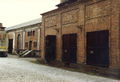
Elektrizitätswerk, Mittelbau und westlicher Erweiterungsbau zur Ottostraße, 1990 Urheber: Reinhard Thielsch
Lizenz: CC BY-SA 3.0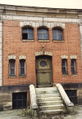
Elektrizitätswerk, Hofseite, Eingang zum Akkumulatorentrakt des Mittelbaus, 1990 Urheber: Reinhard Thielsch
Lizenz: CC BY-SA 3.0
Elektrizitätswerk, Hofseite, Detail des Mittelbaus, 1990 Urheber: Reinhard Thielsch
Lizenz: CC BY-SA 3.0
Elektrizitätswerk, Innenansicht des Mittelbaus, früher Maschinenhalle, 1990 Urheber: Reinhard Thielsch
Lizenz: CC BY-SA 3.0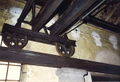
Elektrizitätswerk, Mittelbau, früher Maschinenhalle, Detailansicht der 10t-Kranbahn, 1990 Urheber: Reinhard Thielsch
Lizenz: CC BY-SA 3.0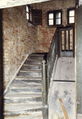
Elektrizitätswerk, Aufgang zum Dachgeschoss des östlichen Erweiterungsbaus, 1990 Urheber: Reinhard Thielsch
Lizenz: CC BY-SA 3.0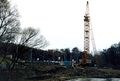
Umbauarbeiten der alten Stau- und Triebwerksanlage der Foerstermühle durch die Infra. Im Hintergrund ... Umbauarbeiten der alten Stau- und Triebwerksanlage der Foerstermühle durch die Infra. Im Hintergrund die Weiherstraße und alter Alter Jüdischer Friedhof im Februar 1988
Urheber: Klaus-Peter Schaack
Lizenz: CC BY-SA 3.0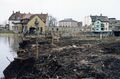
Im Vordergrund Umbau der Stau- und Triebwerksanlage der Foerstermühle durch die Infra, dahinter das ... Im Vordergrund Umbau der Stau- und Triebwerksanlage der Foerstermühle durch die Infra, dahinter das heute noch stehendes Maschinenhaus der schon abgerissenen Forstermühle, daneben das ehem. Fischhäusla. Im Hintergrund Gebäude Würzburger Straße 3+5 und Alter Schlachthof im Februar 1988
Urheber: Klaus-Peter Schaack
Lizenz: CC BY-SA 3.0
Blick über die Uferstraße an der Stadthalle mit Umbauarbeiten der ... Blick über die Uferstraße an der Stadthalle mit Umbauarbeiten der Stau- und Triebwerksanlage der Foerstermühle durch die Infra, dahinter das heute noch stehendes Maschinenhaus der schon abgerissenen Forstermühle, daneben Gebäude Würzburger Straße 3+5. Im Hintergrund Gebäude an der Billinganlage und Klinikum Fürth im Februar 1988
Urheber: Klaus-Peter Schaack
Lizenz: CC BY-SA 3.0
Das 1985 erbaute Wasserwerk an der Dianastraße unterhalb der Siebenbogenbrücke am 4.1.1988 Urheber: Klaus-Peter Schaack
Lizenz: CC BY-SA 3.0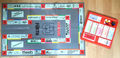
Tycoon (Monopoly), Fürth-Ausgabe aus dem Jahr 1986. Herausgegeben von den Stadtwerken Urheber: Stadtwerke Fürth
Lizenz: Copyright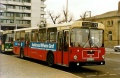
Buslinie 73 am Fürther Hauptbahnhof Lizenz: CC BY-SA 3.0
Broschüre Wasser für Fürth - 100 Jahre Wasserversorgung - Titelseite Urheber: Stadtwerke
Lizenz: Copyright
Nürnberger OB Andreas Urschlechter mit OB Kurt Scherzer beim Unterzeichnen des ... Nürnberger OB Andreas Urschlechter mit OB Kurt Scherzer beim Unterzeichnen des Gasversorgungsvertrages beider Städte, Mrz 1984
Lizenz: Bildlizenz-Stadtarchiv
Nürnberger OB Andreas Urschlechter mit OB Kurt Scherzer beim Unterzeichnen des ... Nürnberger OB Andreas Urschlechter mit OB Kurt Scherzer beim Unterzeichnen des Gasversorgungsvertrages beider Städte, Mrz 1984
Lizenz: Bildlizenz-Stadtarchiv
OB Scherzer bei den Feierlichkeiten zur 125-jährigen Gasversorgung in Fürth, Juli 1982 Urheber: unbekannt
Lizenz: Bildlizenz-Stadtarchiv
OB Scherzer bei den Feierlichkeiten zur 125-jährigen Gasversorgung in Fürth, Juli 1982 Urheber: unbekannt
Lizenz: Bildlizenz-Stadtarchiv
Broschüre 75 Jahre Gaswerk an der Leyher Straße - Titelseite Urheber: Stadtwerke
Lizenz: Copyright
Ersttagsbrief zur Jubiläums Veranstaltung "100 Jahre Stadtverkehr in Nürnberg-Fürth" vom 29.8.1981 Urheber: Deutsche Bundespost
Lizenz: CC BY-SA 3.0
Ersttagsbrief zur Jubiläums Veranstaltung "100 Jahre Stadtverkehr in Nürnberg und Fürth" vom ... Ersttagsbrief zur Jubiläums Veranstaltung "100 Jahre Stadtverkehr in Nürnberg und Fürth" vom 30.08.1981
Urheber: Deutsche Bundespost
Lizenz: CC BY-SA 3.0
Plan der Fürther Buslinien ab 21.Juni 1981 aus einer Broschüre der Stadtwerke Fürth. Urheber: Stadtwerke Fürth
Lizenz: CC BY-SA 3.0
Broschüre Das Fürther Straßenbahn-Jahrhundert - Titelseite Urheber: Stadtwerke
Lizenz: Copyright
Broschüre und Chronik Das Fürther Straßenbahn-Jahrhundert von 1981 Urheber: Stadtwerke Fürth
Lizenz: Copyright
Horst Staackmann, Werkleiter der Stadtwerke von 1977 - 1997 Urheber: SPD Fürth
Lizenz: CC BY-SA 3.0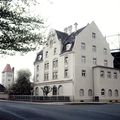
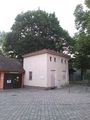
Verwaltungsgebäude des ehemaligen Gaswerks, Jugendstil-Putzbau, (1903 - 1906), Zustand um 1980 Urheber: unbekannt
Lizenz: CC BY-SA 3.0
Verwaltungsgebäude des ehemaligen Gaswerks, Jugendstil-Putzbau, (1903 - 1906), Zustand um 1980 Urheber: unbekannt
Lizenz: CC BY-SA 3.0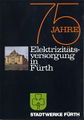
Broschüre 75 Jahre Elektrizitätsversorgung in Fürth - Titelseite Urheber: Stadtwerke
Lizenz: Copyright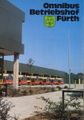
Broschüre Omnibus Betriebshof Fürth - Titelseite Urheber: Stadtwerke
Lizenz: Copyright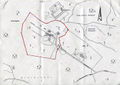
Lageplan der Lungenheilstätte im Stadtwald und Steinbruch Katzenstein (Hochbehälter), ca. 1975 Urheber: unbekannt
Lizenz: CC BY-SA 3.0
Briefbogen der Stadtwerke Fürth jetzt Infra fürth gmbh vom Juli 1972 Urheber: Stadtwerke Fürth
Lizenz: CC BY-SA 3.0
Stadtwerkedirektor Hans Drechsel 1970 Urheber: Werner Peterson
Lizenz: copyright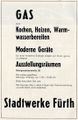
Werbung der Stadtwerke Fürth, 1970 Urheber: Stadtwerke Fürth
Lizenz: CC BY-SA 3.0
Originalunterschrift Hans Drechsel von 1969 Lizenz: CC BY-SA 3.0
Lehrlings Streckenkarte der VAG von 1963 zwischen Stadeln und Fürth Flößaustraße Urheber: VAG
Lizenz: CC BY-SA 3.0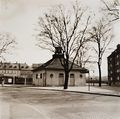
Das Uhrenhäusla an der Erlanger Str. in Blickrichtung Espan / Poppenreuth. Aufnahme 1956 Urheber: Bruno Siegert, Fürth
Lizenz: CC BY-SA 3.0
.jpg)
.jpg)
.jpg)


.jpg)


.jpg)


.jpg)

.jpg)
.jpg)
.jpg)
.jpg)
.jpg)
.jpg)
.jpg)
.jpg)
.jpg)
.jpg)


.jpg)


.jpg)


.jpg)

.jpg)
.jpg)
.jpg)
.jpg)


